|
||
|
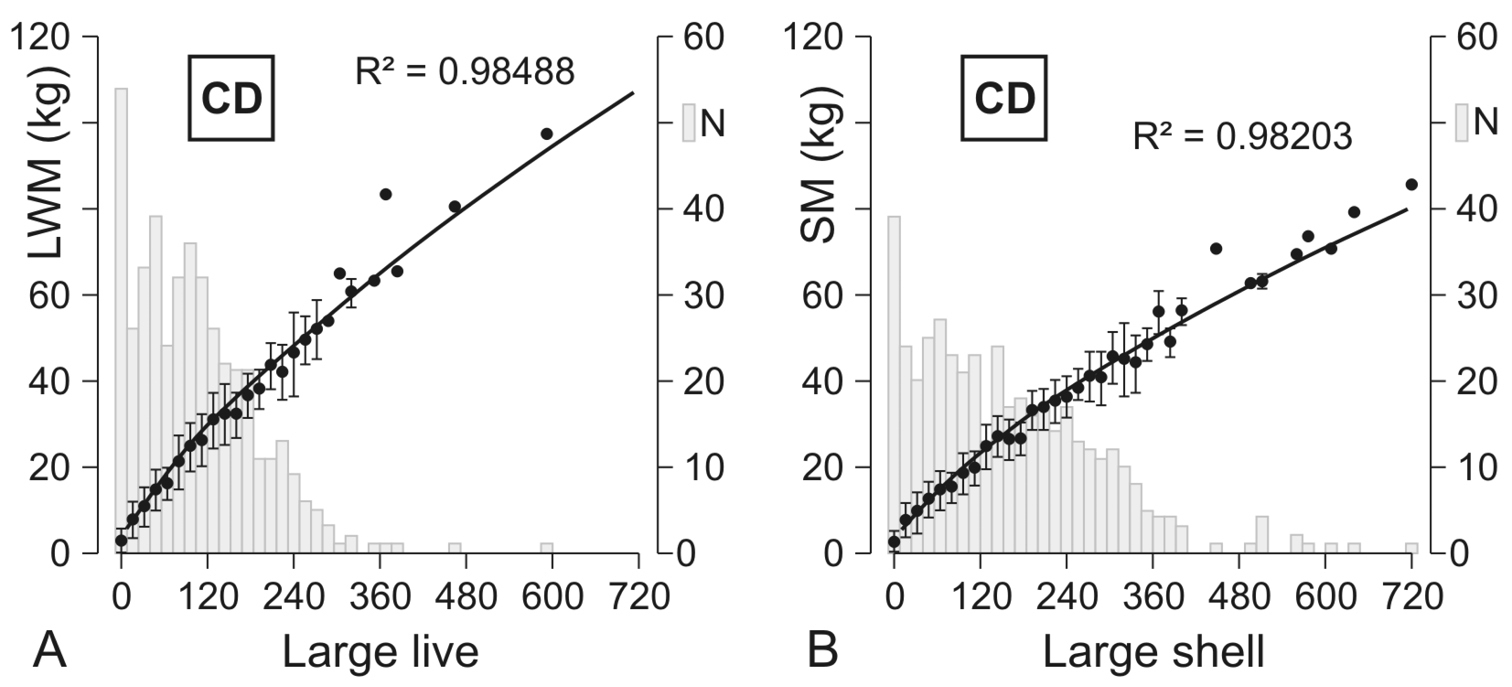
CD-density scaling of large oysters. A Plotted is LWM (kg) ± SD against large live oysters per abundance class. B Plotted is SM (kg) ± SD against large oyster shell per abundance class. Abundance classes derived from pooling 432 stations to intervals of 16 large oyster CD, respectively. N = Number of stations per abundance class (bars). Powered relationship indicated and coefficient of determination (R²) given. Scaling parameters listed in Table 2 (7, 8). Density metrics and density attributes according to Figure 3. |