|
||
|
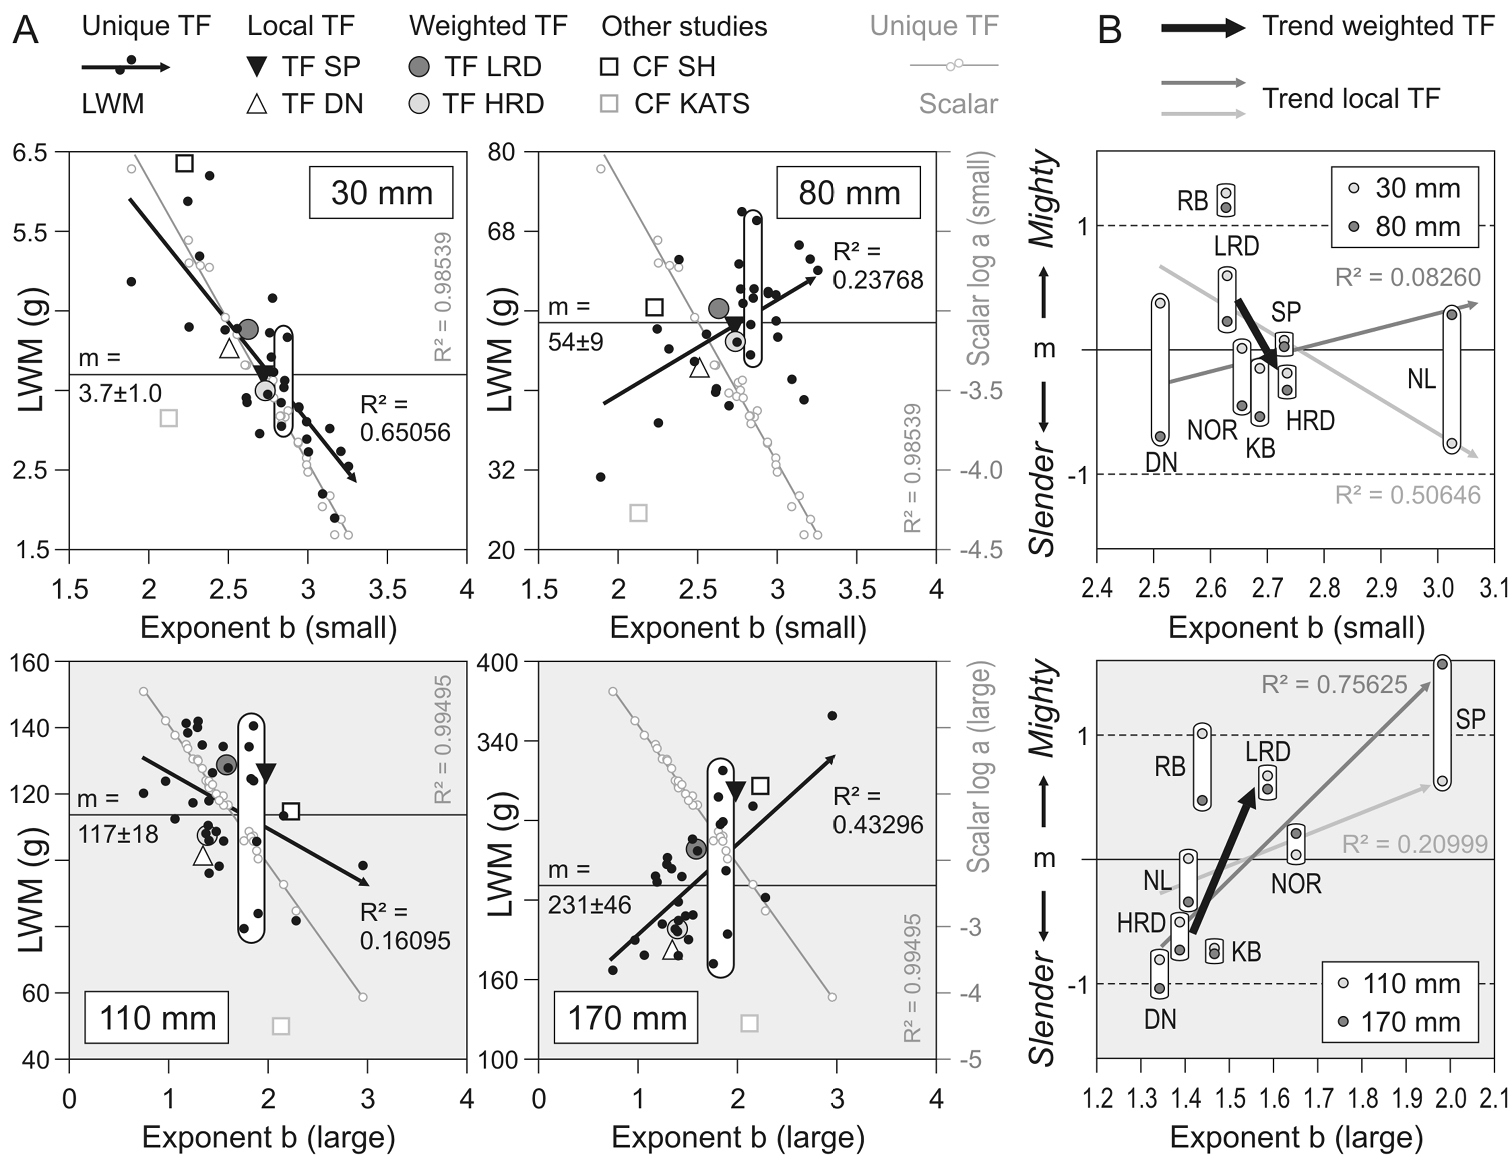
Relationship between scaling exponent and oyster LWM (g) of selected small (SL 30/80 mm, top) and large (SL 110/170 mm, bottom) individuals. A Plotted is LWM resulting from unique TF, selected local TF (SP for mighty and DN for slender shaped oysters), weighted TF (LRD, HRD) and CF of two other studies (SH, KATS) against exponent, respectively. Mean LWM (horizontal line, m ± SD) and linear trend of increasing or decreasing LWM with increasing exponent of unique TF indicated (black arrow, R²). Variability of LWM resulting from similar exponents of unique TF highlighted (rounded boxes). Additionally plotted is the exponential relationship (broken line, R² upend) between scalar and exponent of unique TF (gray circles). B Plotted is relative shape resulting from local TF (SP, RB, NOR, NL, KB, DN) and weighted TF against exponent. Relative shape = (LWM-m)/SD with 0 = m and 1 = SD. Change of oyster shape with increasing exponent is displayed as a linear trend between sites (gray arrows, R²). Trend between reef types indicated (black arrow). R² = coefficient of determination. |