|
||
|
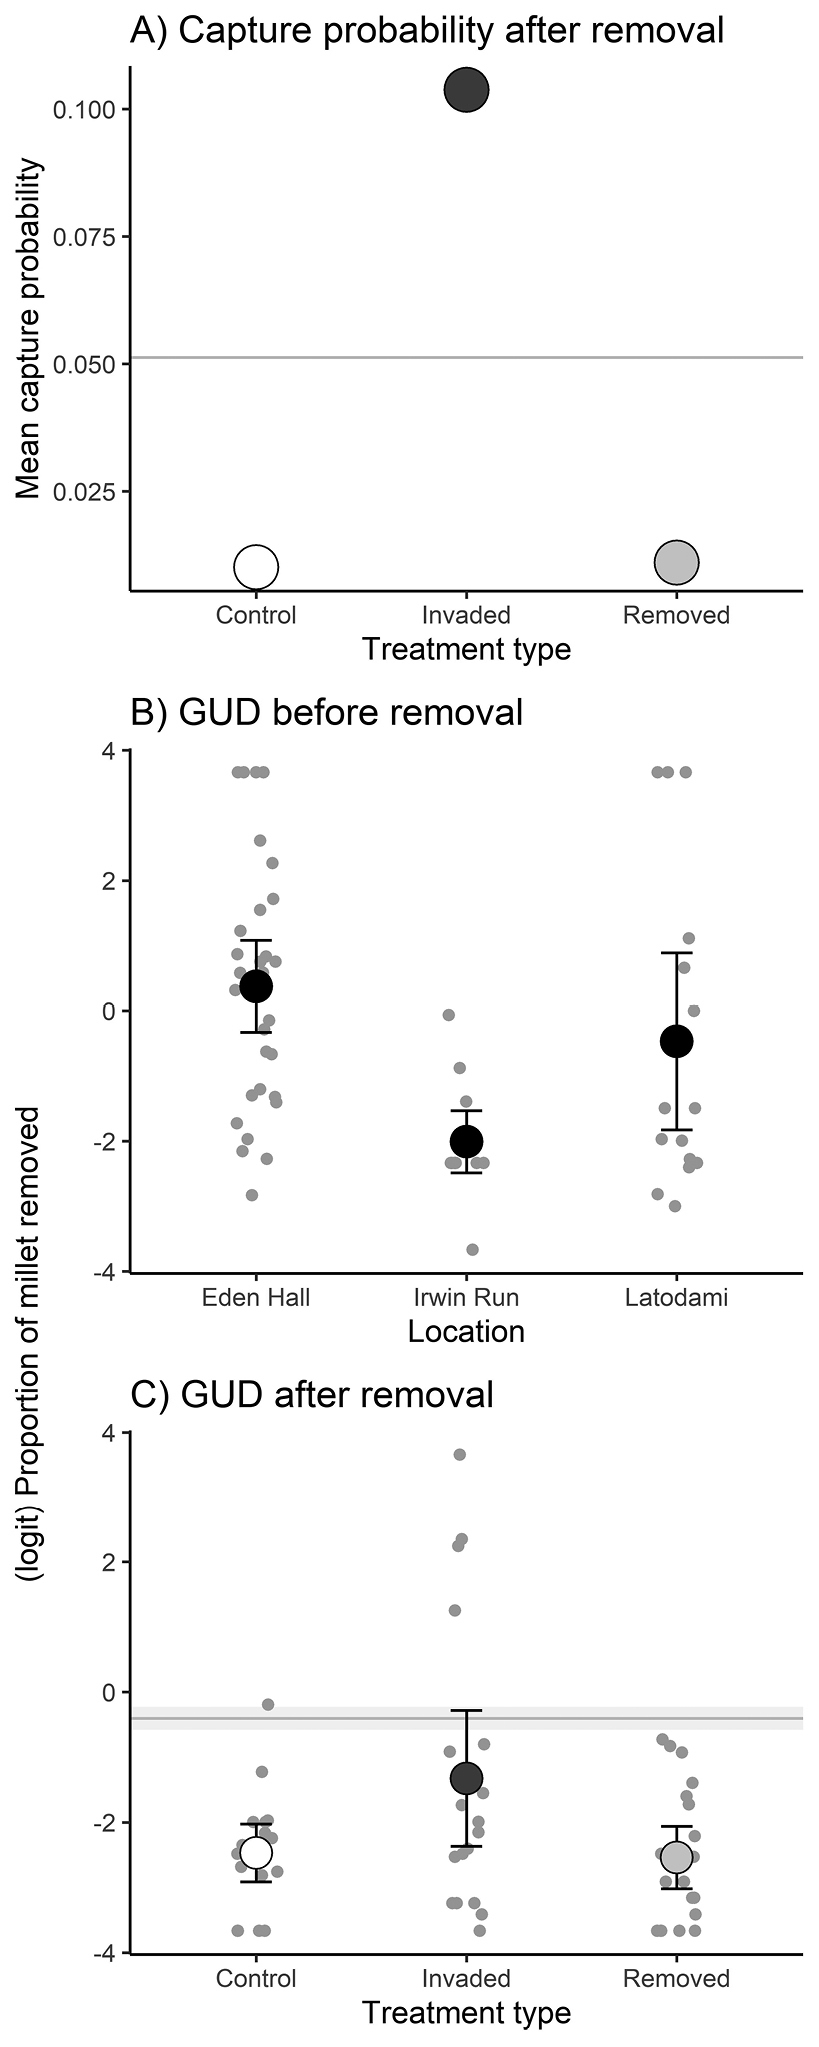
A Mean capture rates of small mammals during the period after experimental barberry removal delineated by plot type. The horizontal line illustrates the mean capture rate across all locations and treatments during the period prior to experimental barberry removal B mean (± 95% confidence intervals) giving-up densities delineated by location before the experimental barberry removal and C by treatment type for the period after barberry removal. The line and associated gray ribbon illustrate the mean ± 95% confidence interval for giving-up densities across all treatments and locations before barberry removal. |