|
||
|
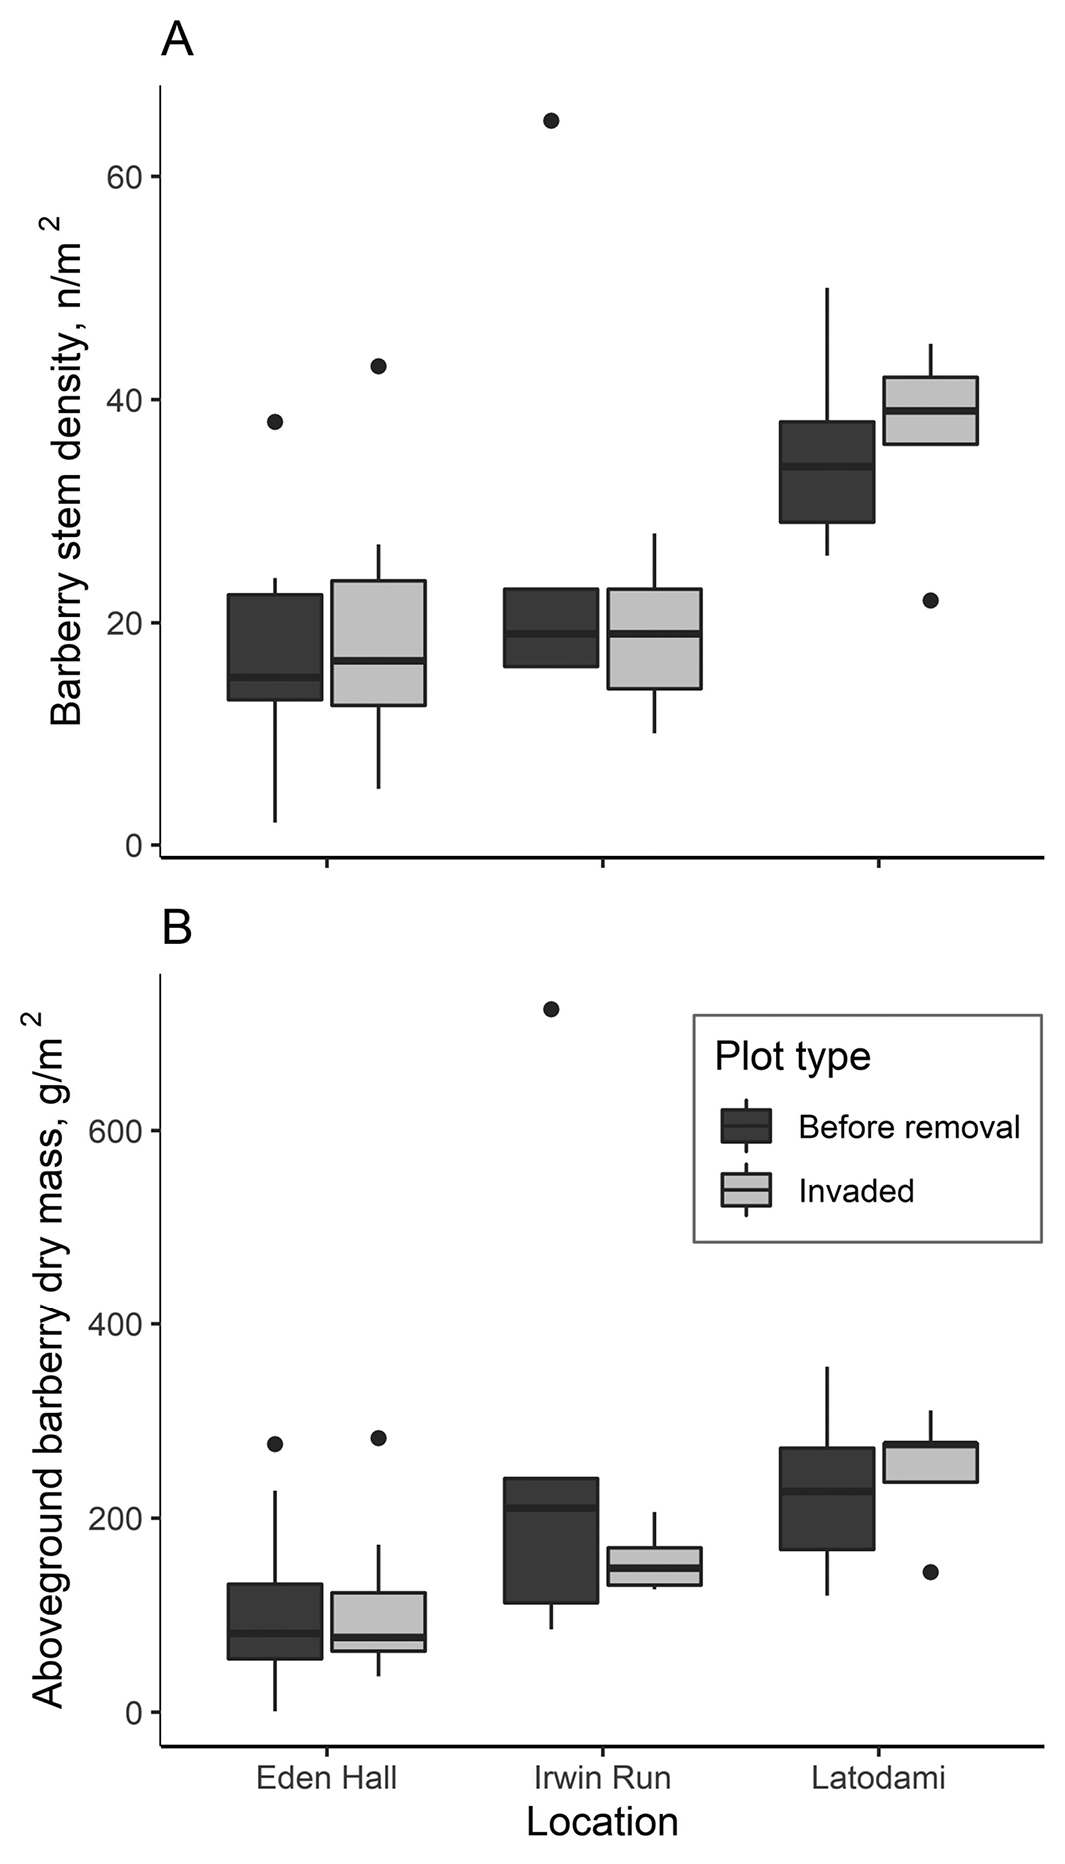
Distribution of A barberry stem densities and B barberry aboveground biomass in removal (prior to eradication) and invaded plot types, delineated by location. No barberry plants were recorded in control plots. Stem densities were assessed with a generalized linear model and Poisson error distribution; values significantly varied among locations (χ2 = 87.4, df = 2, p < 0.0001) but not plot types (χ2 = 0.7, df = 1, p = 0.4175). Barberry biomass was assessed with a linear model; values significantly varied among locations (F2,36 = 5.7, p = 0.0073) but not plot type (F1,36 = 0.5, p = 0.4891). |