|
||
|
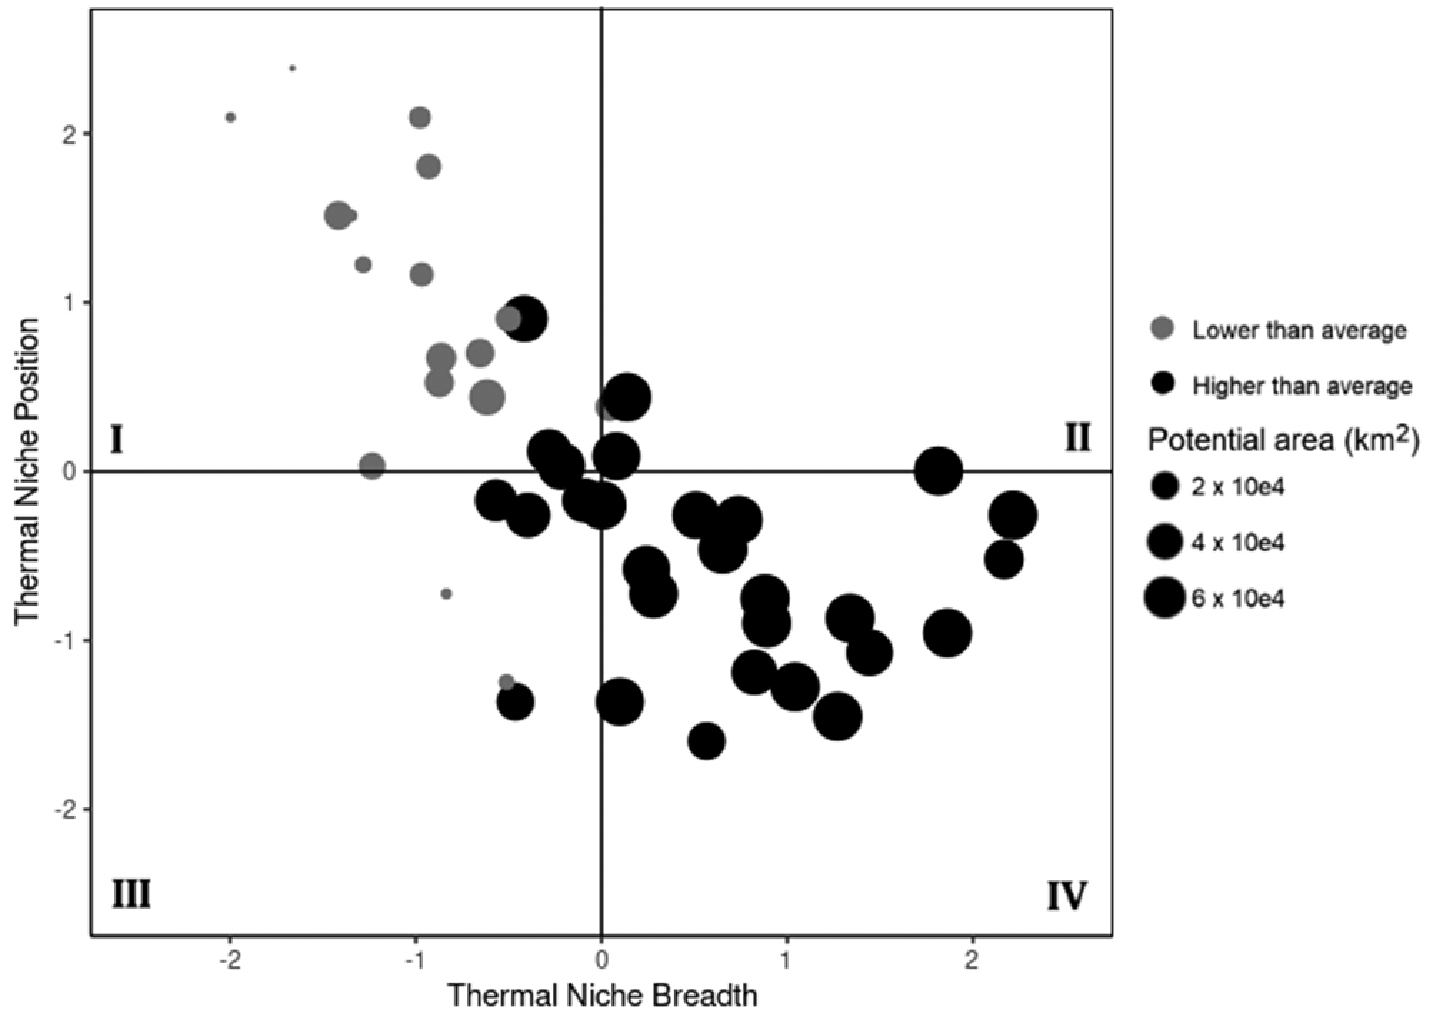
Summary of species position in a bidimensional-plane whose axes are standardized thermal niche breadth and thermal niche position from a sample of 49 exotic plants in Chile. Niche values were standardized using the expression ((NT)_i-aNT))/σNT. The point (0, 0) represents the average values of both niche traits. Quadrant I represent the area of low invasiveness; Quadrant IV represents the area of high invasiveness. Dots represent the position of species within the two-phase plane. Dots size represents species distribution size. Gray dots: species with distribution size lower than average: black dots: species with distribution size higher than average. |