|
||
|
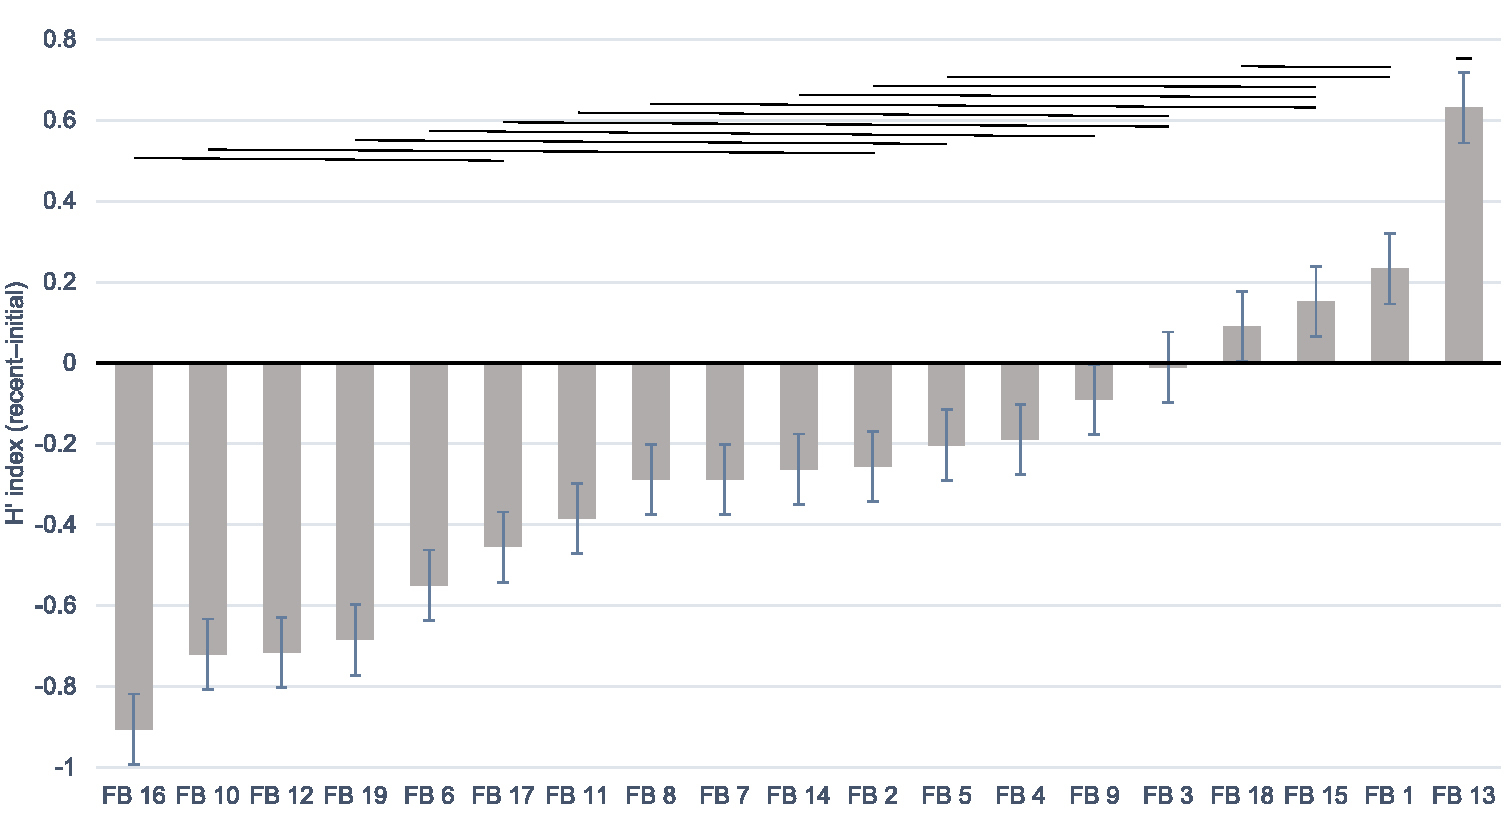
Bar plot depicting changes in the Shannon-Wiener diversity index (i.e. H’; recent minus initial). Negative values show a decrease in diversity while positive values represent an increase in diversity over the study period. Segment lines show the standard error. Lines above the bars indicate significant differences amongst the flowerbeds at the level of p < 0.05 (Tukey’s HSD test). |