|
||
|
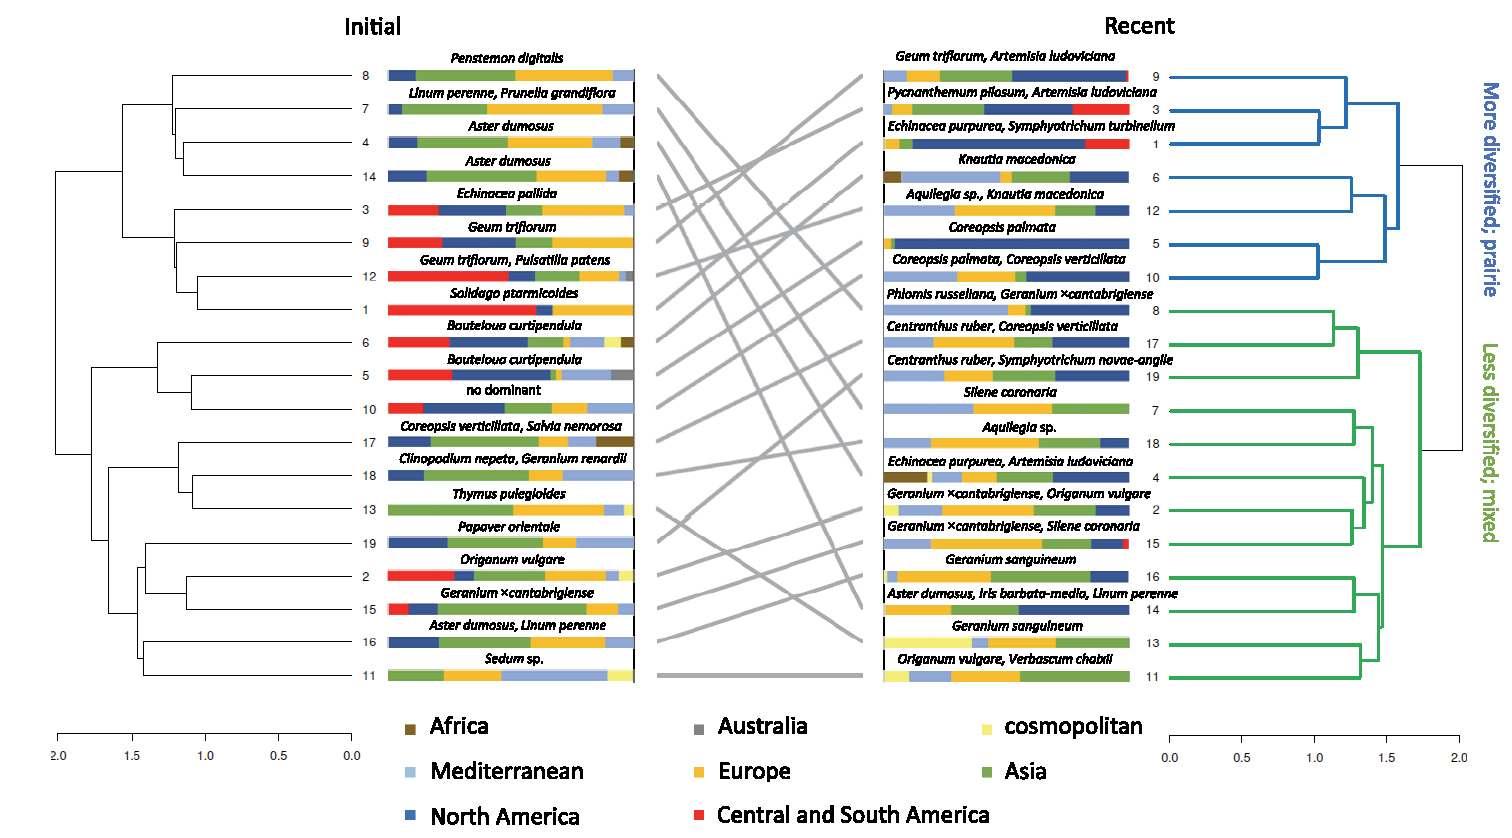
Cluster tree diagrams comparing initial and recent assemblages based on the average abundance. The cluster analysis distinguished two main clusters in the recent time assemblages. The bars represent the percentage contribution of taxa for a given origin. Only taxa that are highly abundant in the FB are shown by names. As the dominant taxa change over time, they are shown for both initial and recent stages. |