|
||
|
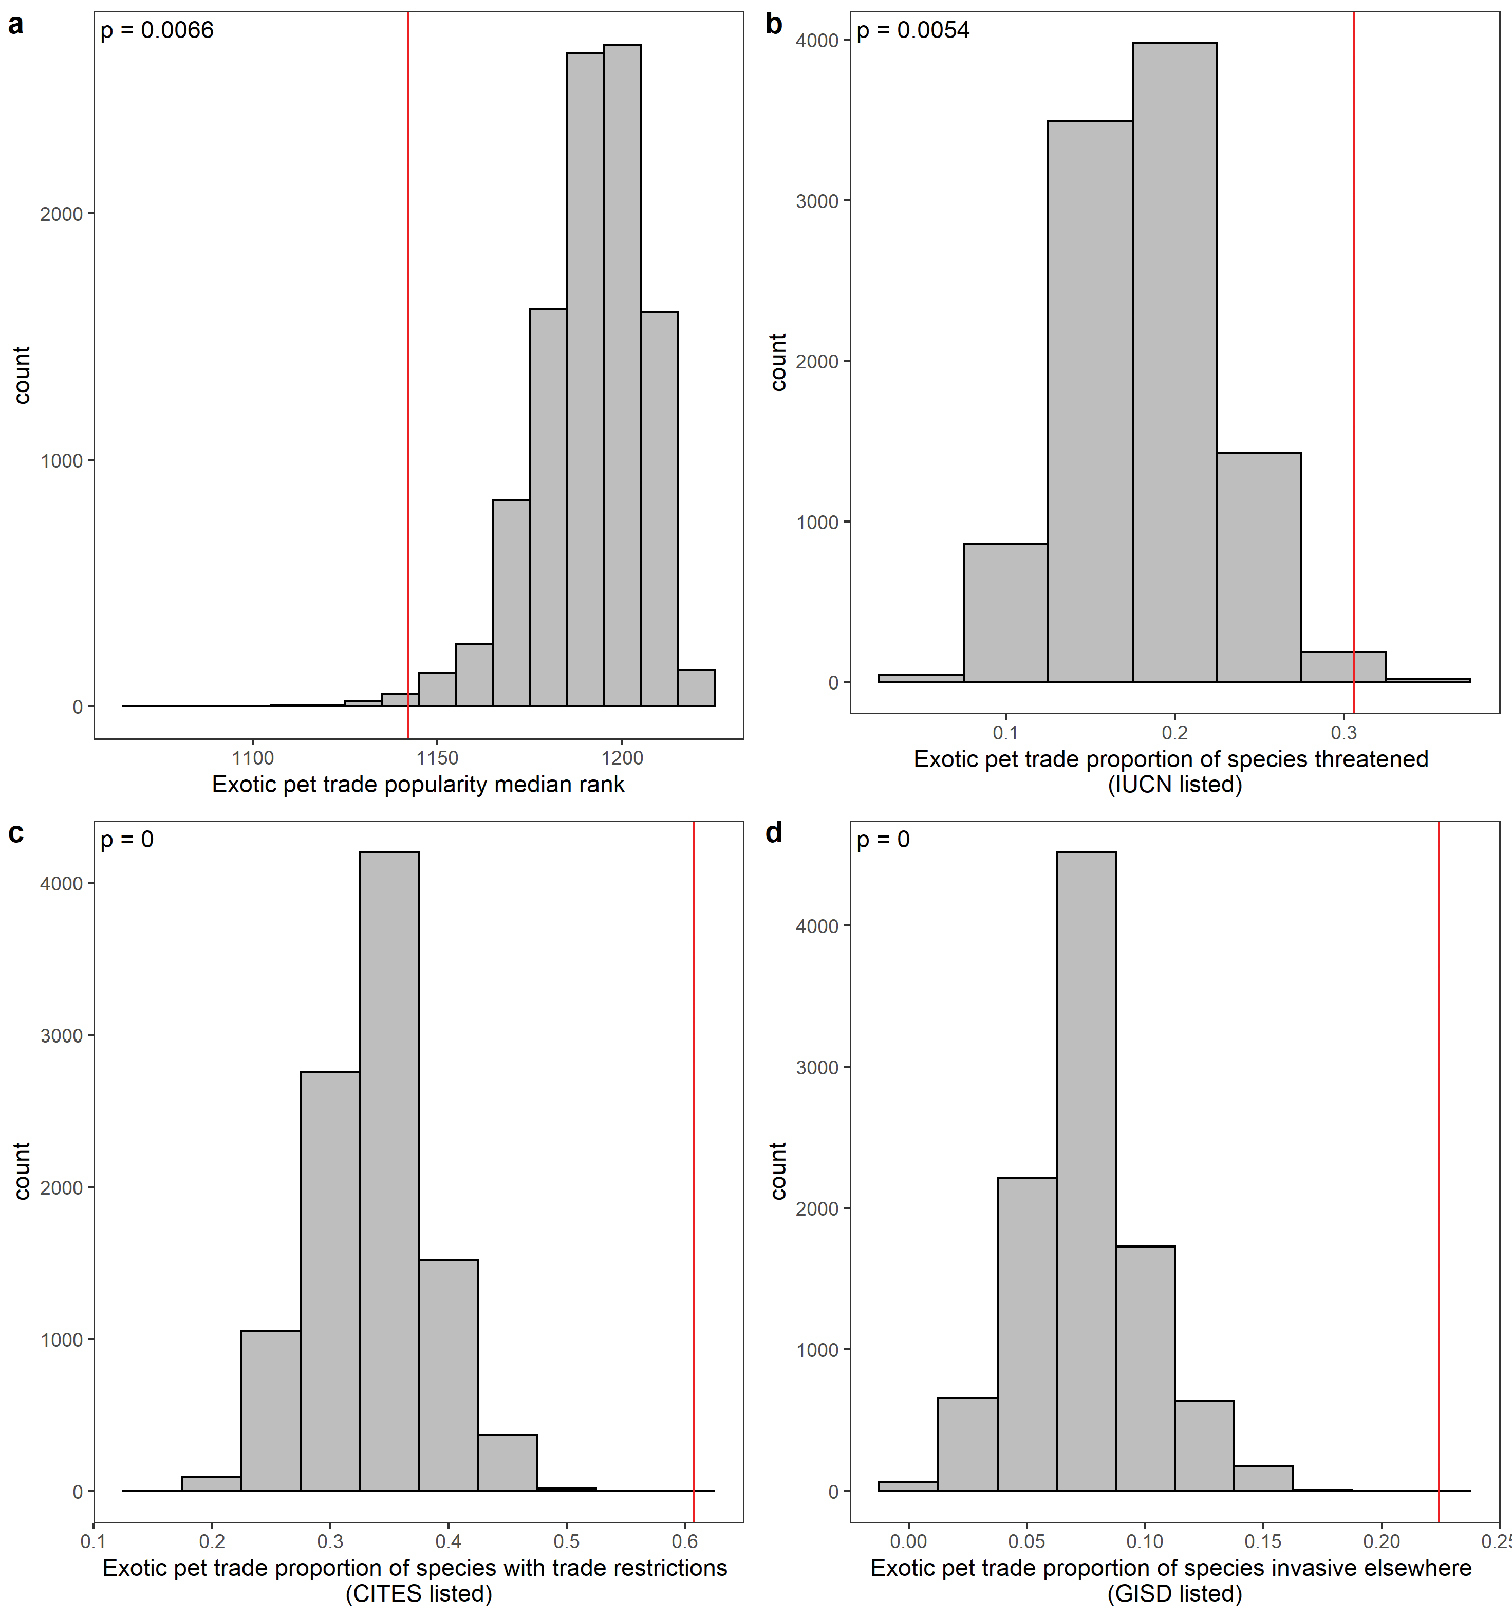
Empirical hypothesis tests comparing: (a) enquired species popularity; (b) proportion of threatened species; (c) proportion of international trade-restricted species; and (d) proportion of invasive species, to the overall exotic pet trade. Each histogram represents 10,000 iterations of random sampling from the U.S. Fish and Wildlife imports dataset from 1999–2016 (representative of the Western exotic pet trade), stratified by taxonomic class. Red lines correspond to the ‘observed’ median rank or proportion from the enquired species. P-values are calculated as the proportion of sampling iterations that fall to the left or right of the observed rank or proportion. Non-vertebrate taxa were not included in these analyses. |