|
||
|
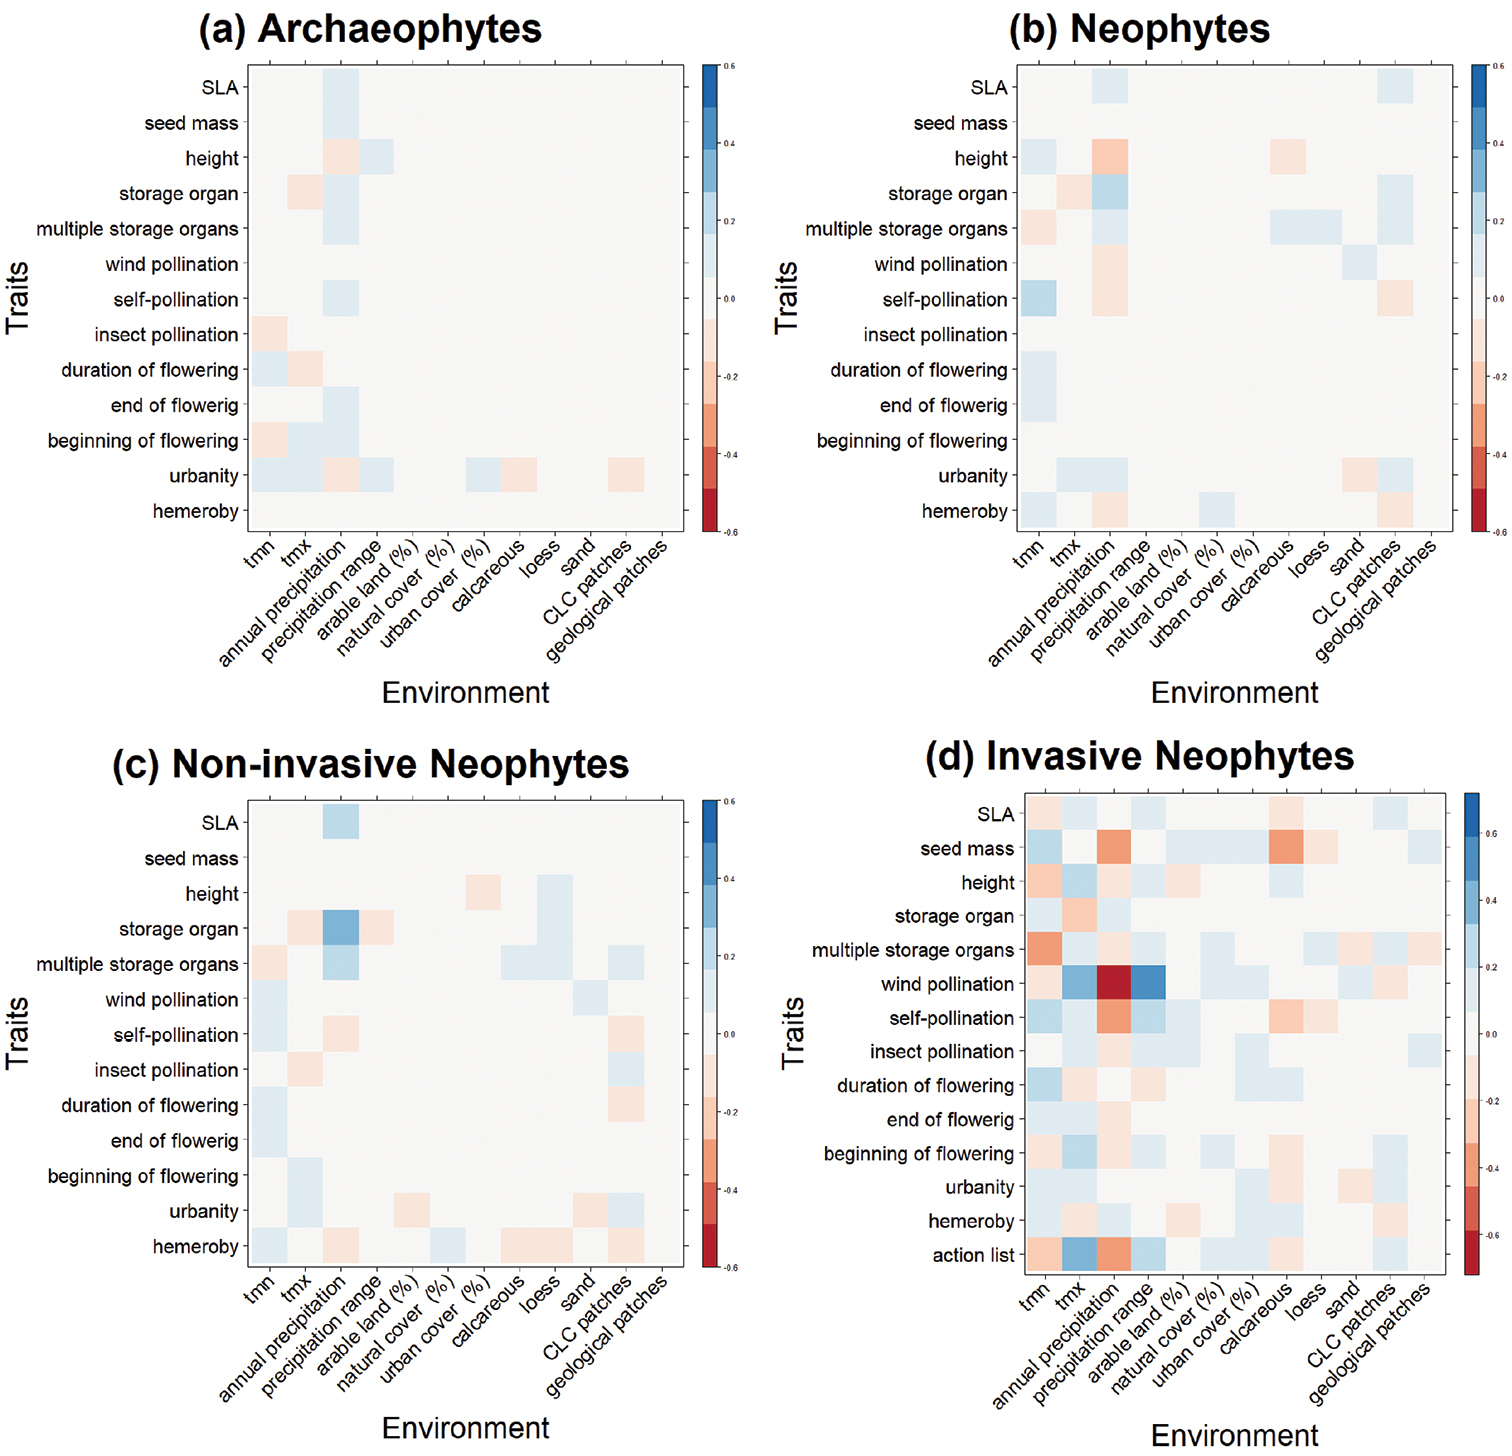
Fourth-corner plots for a archaeophytes b all neophytes lumped together regardless of status c non-invasive neophytes, and d invasive neophytes. Figure shows standardized interaction coefficients for plant traits (y-axis) and environmental variables (x-axis). Strong relationships are shown in blue (positive) and red (negative) while color intensity shows interaction strength with coefficient values on log scale. Abbreviations: tmn – mean temperature of the coldest month; tmx – mean temperature of the warmest month; CLC patches – total number of Corine Land Cover patches per grid cell. |