|
||
|
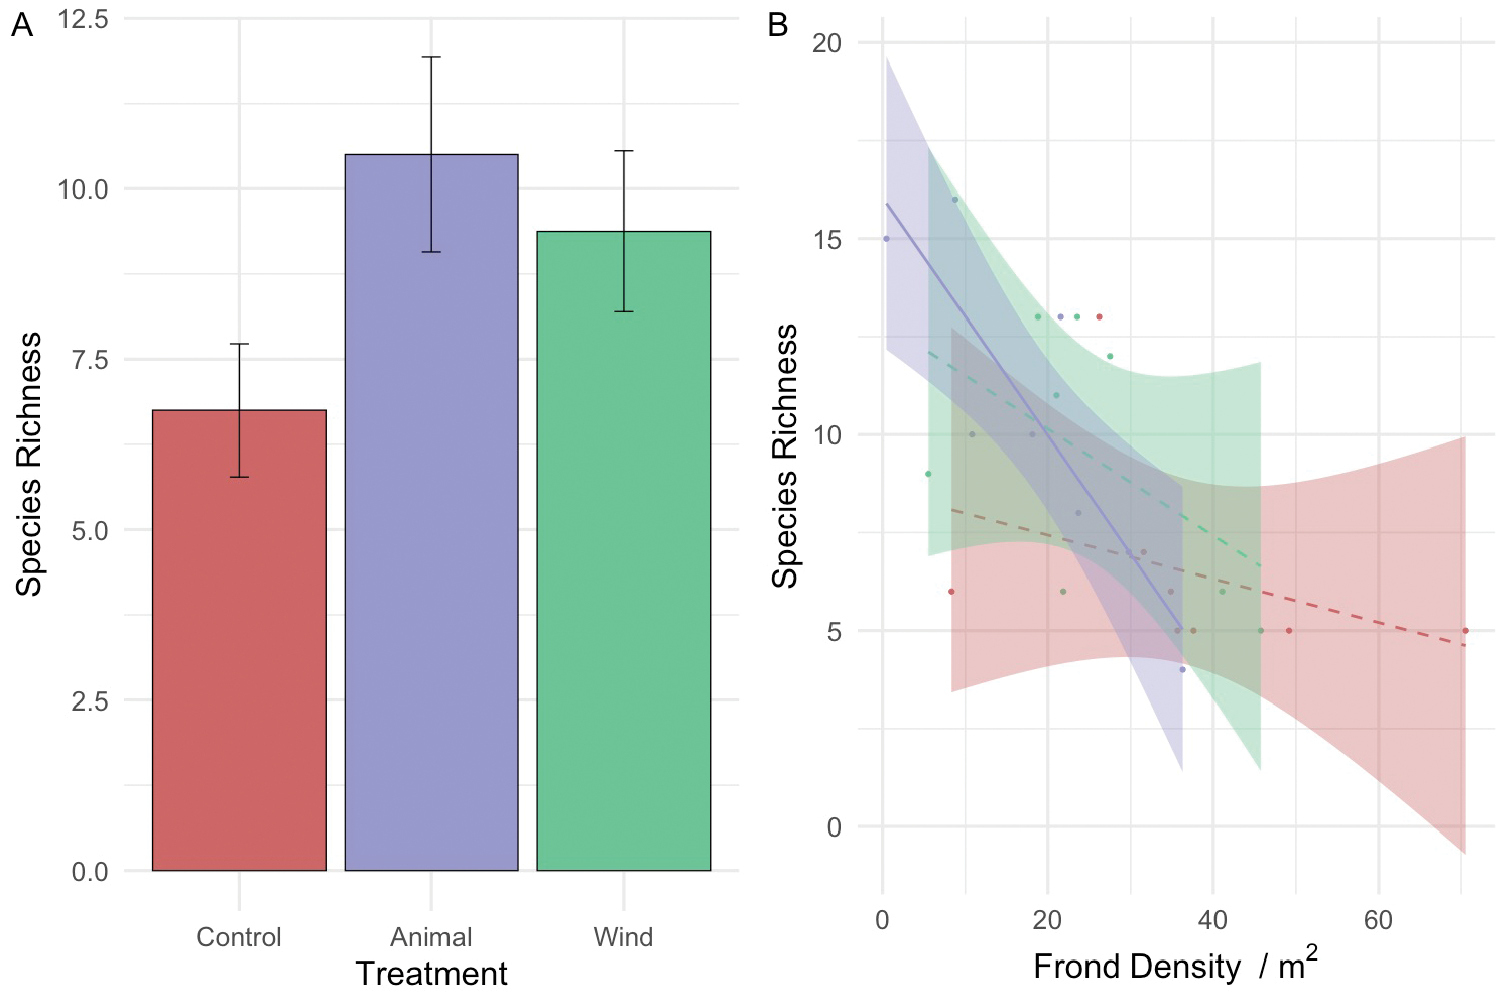
Species richness by A treatment and in response to B frond density at a plot scale. Error bars represent standard error. Band shade represents 95% confidence intervals. Dashed lines indicate non-significant correlations (p > .1). Solid lines indicate significant correlations (p < .05). |