|
||
|
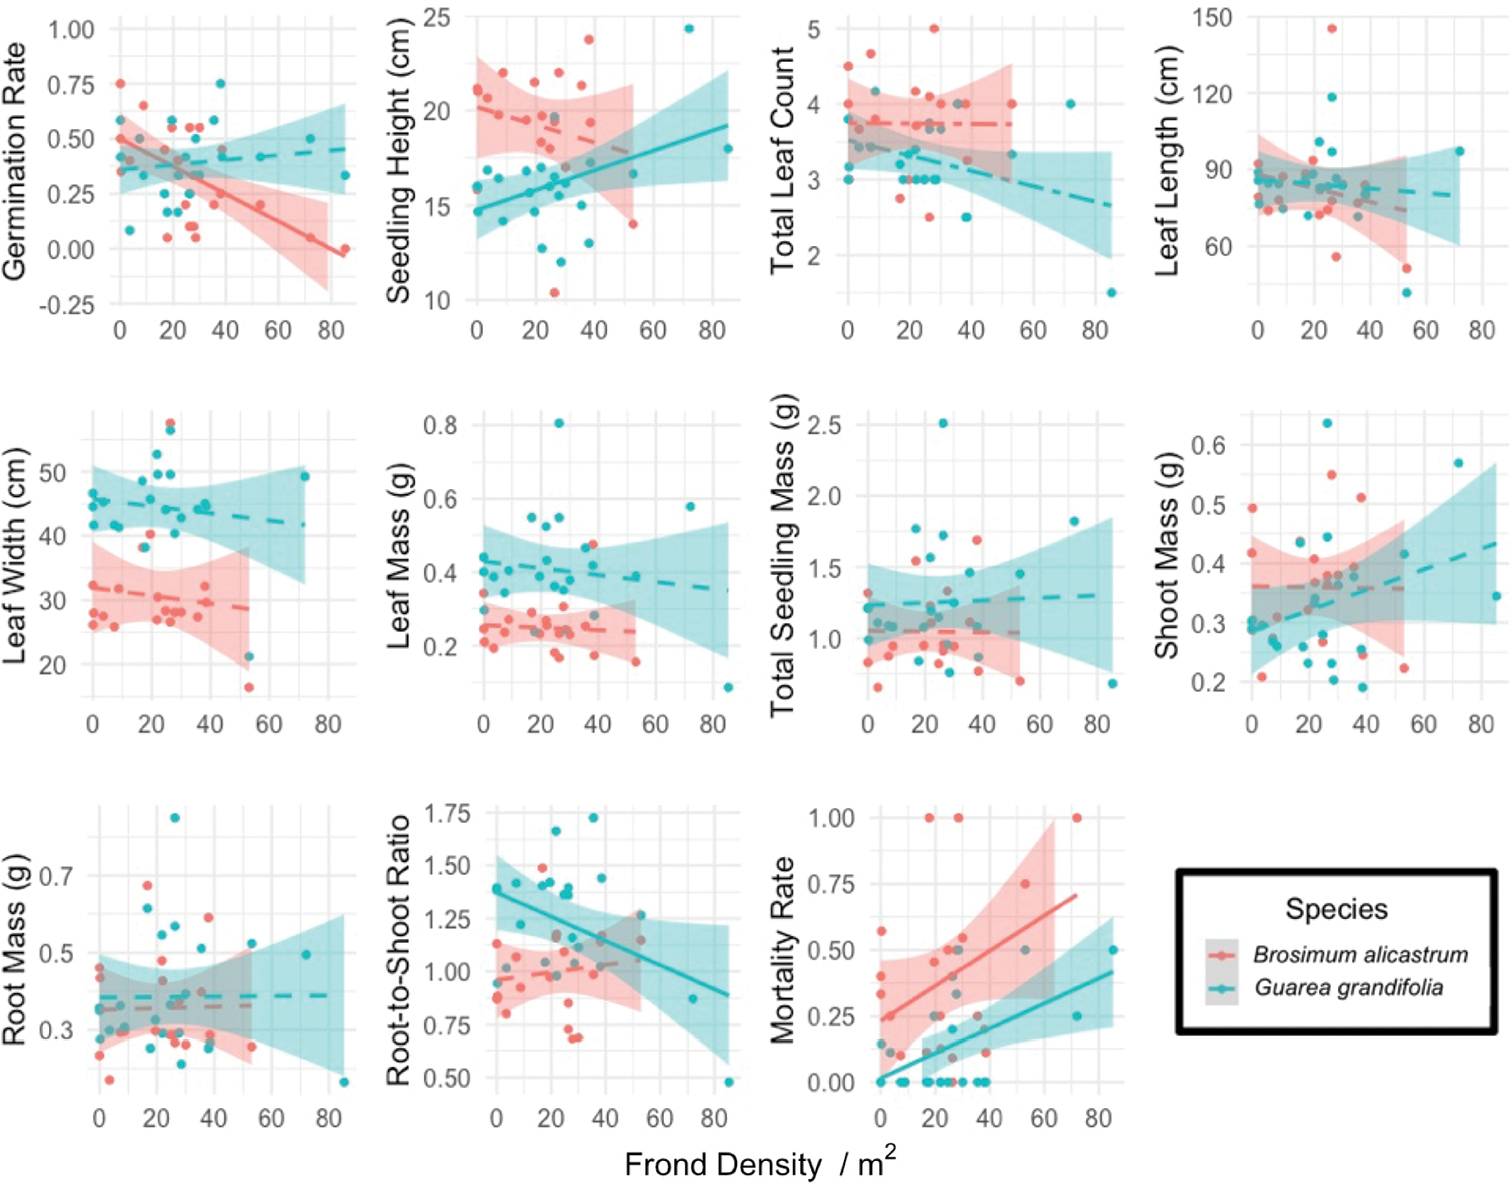
Seedling biomass responses of Brosimum alicastrum and Guarea grandifolia to frond density (m2). Frond density values are the averages of each subplot’s quadrat measurements where seeds were sown. Band shade represents 95% confidence intervals. Dashed lines indicate non-significant correlations (p > .1). Two-dashed lines indicate marginally significant correlations (.05 < p < .1). Solid lines indicate significant correlations (p < .05). |