|
||
|
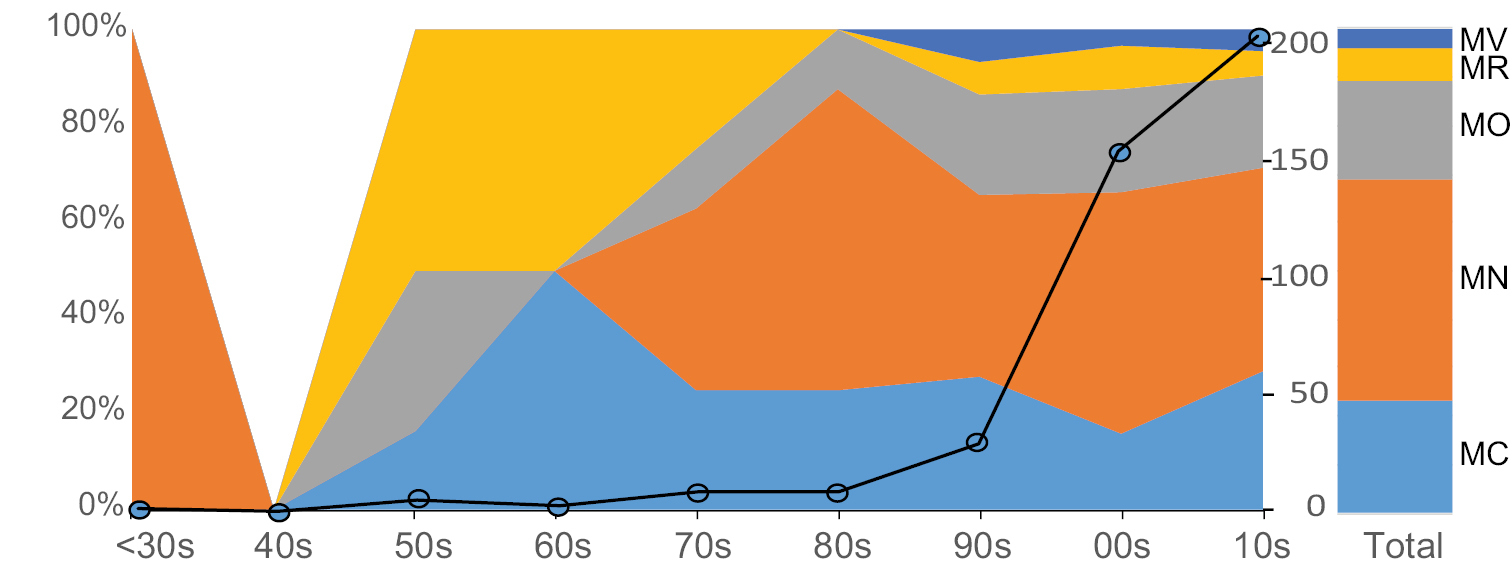
The change in the proportion of amphibian EICAT impact scores over time (decadal scores starting from the 1930s). Solid shapes represent the percentage of scores (left scale) with totals for the entire period and score codes on the right (total = 424). Black line shows number of papers scored in the same decadal time slots, with scale to the right. |