|
||
|
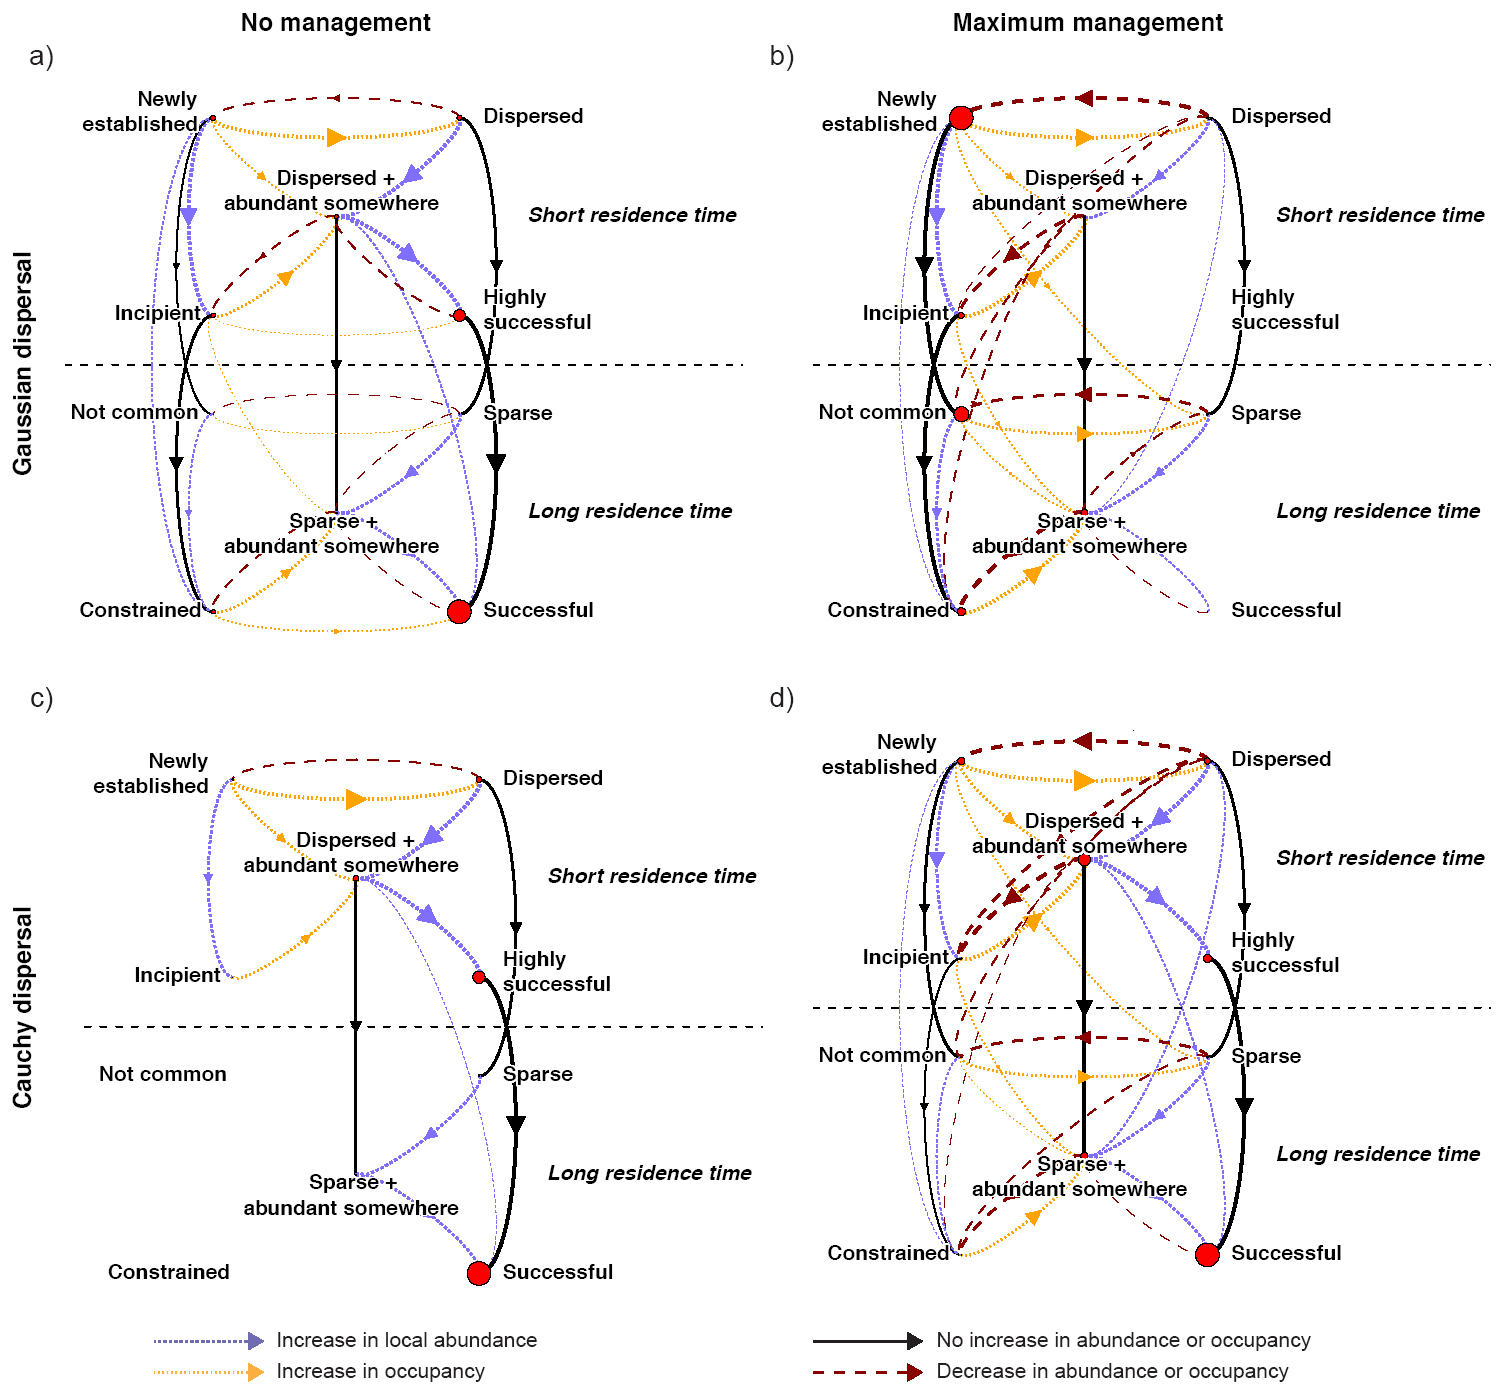
Transitions between different categories of commonness without (a, c) and with (b, d) maximum cross-boundary management (lowest and highest interception efficacy and synchronisation), for logistic growth, using the framework presented in Fig. 1, for the Gaussian (a, b) and Cauchy (c, d) dispersal kernel. Arrow width represents the frequency with which a metapopulation transited from one category to another, averaged over all combinations of growth and dispersal rate (i.e. averaging all cells in a matrix of Fig. 3). As in Fig. 1B, blue arrows represent an increase in local abundance, an orange represents an increase in occupancy, and black arrows represent no increase in either. Dark red arrows represent a decrease in either abundance or occupancy (which can happen as when abundance and occupancy values are close to the thresholds, and migrating propagules are intercepted). Simulations have been done for 20 patches with a carrying capacity K = 10 000, and the outputs were averaged over 20 replicates. |