|
||
|
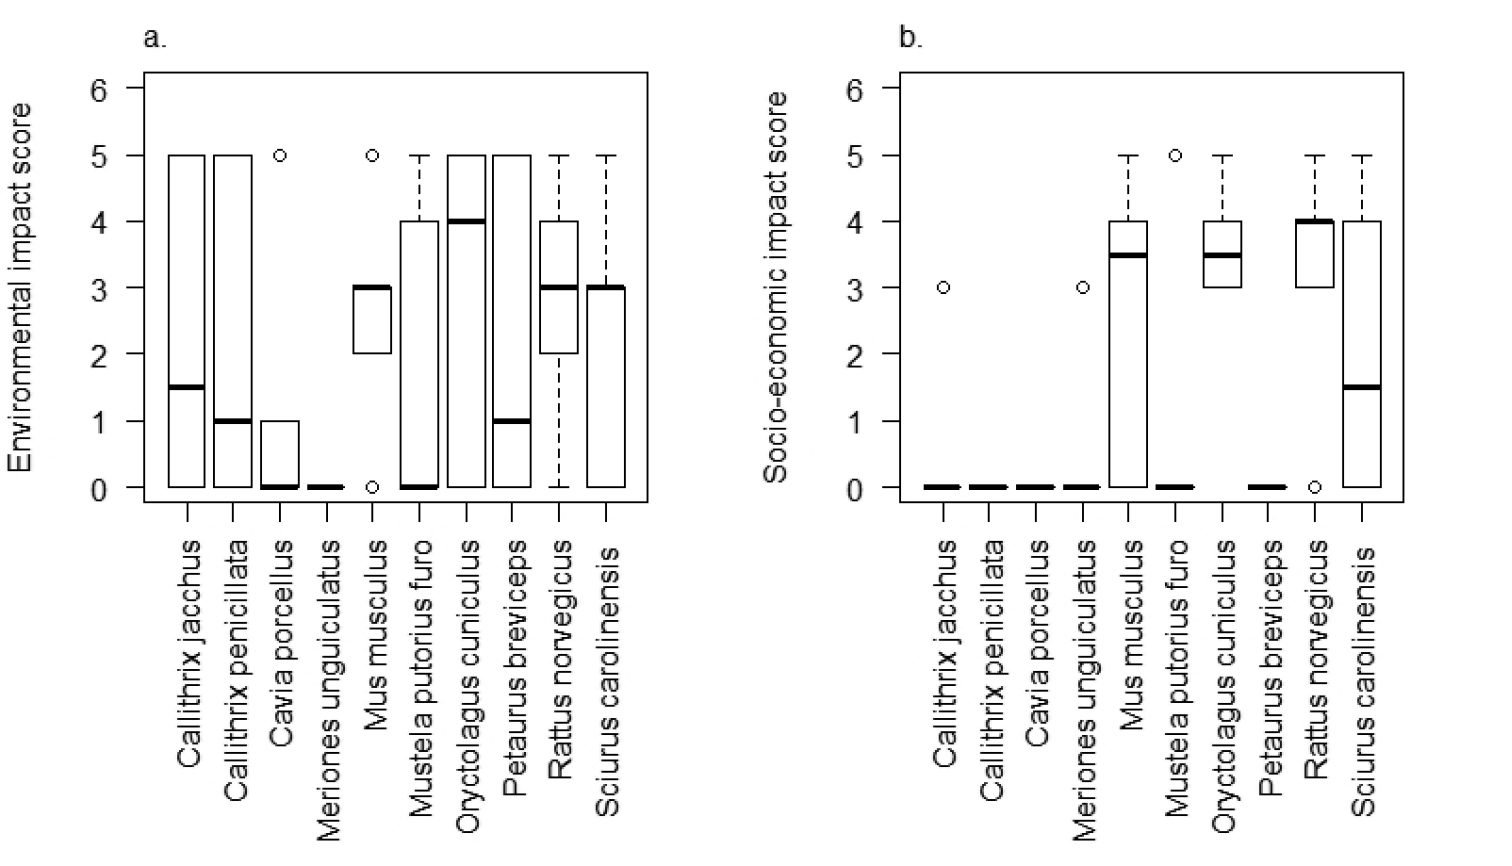
Box-plot showing a environmental and b socio-economic impact scores for the10 non-native small mammals available in the South African pet trade. (Boxes shows the 25th and 75th percentiles and whiskers (values below and above 5 and 4.5 for environmental and socio-economic respectively were considered as outliers) indicate maximum range, interquartile range, median, and the minimum range). |