|
||
|
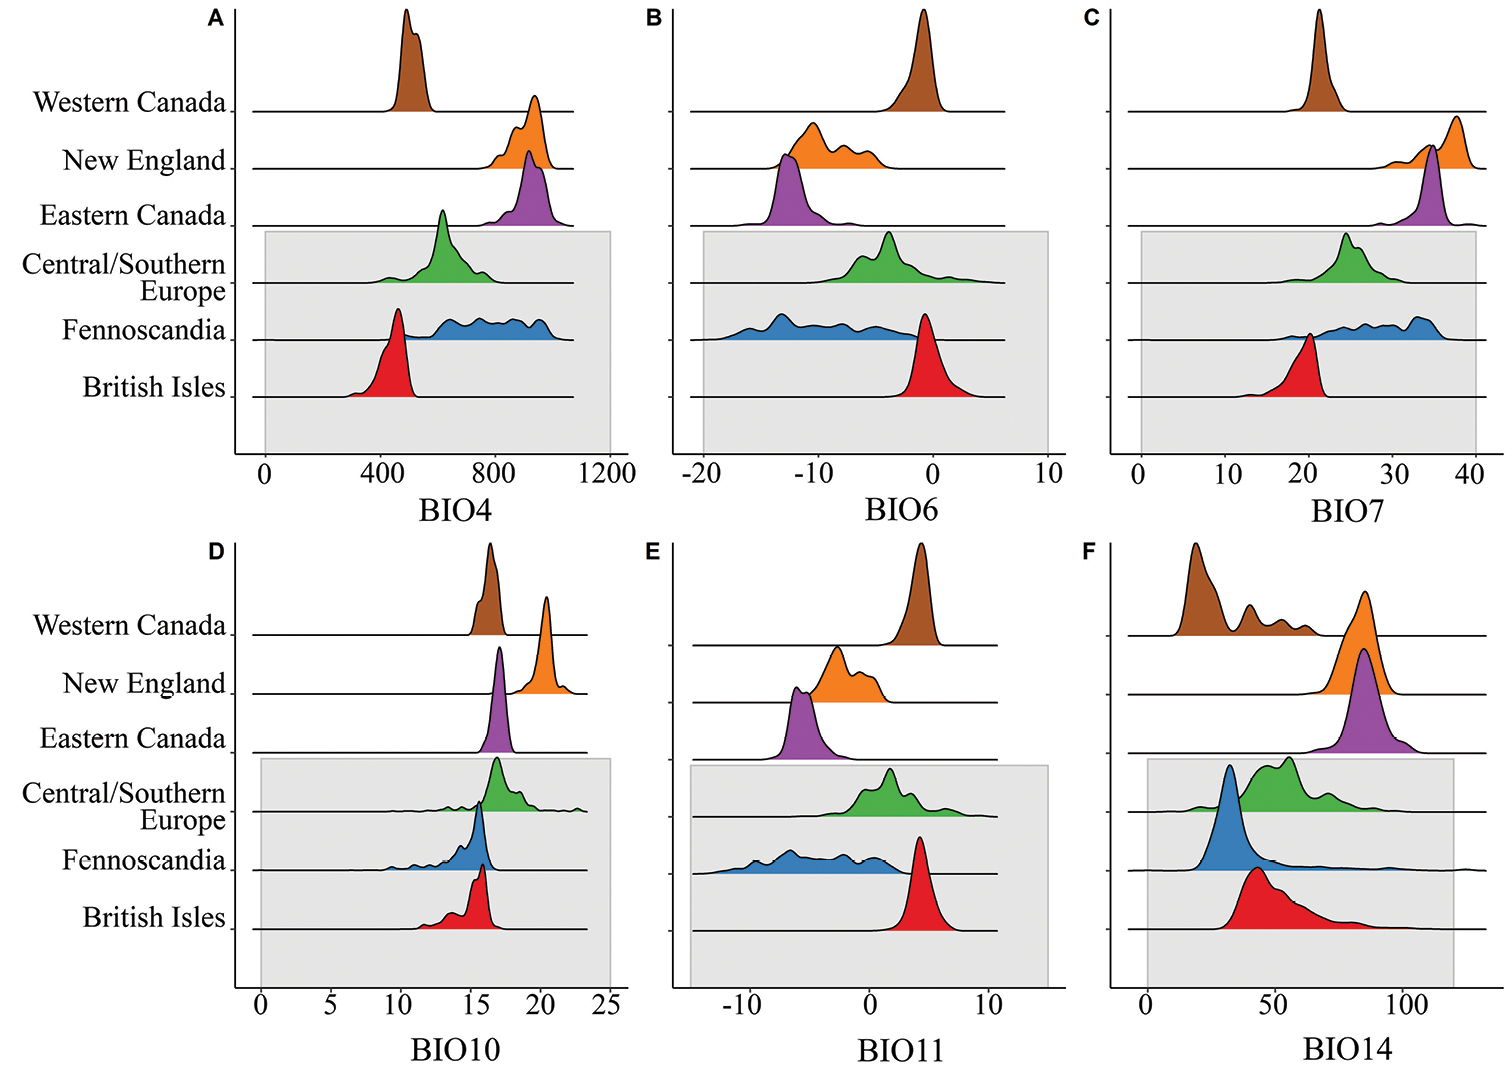
Distribution of bioclimatic variables among occurences within various geographic bins. Gray shading represents winter moth records in the native range. Bioclimatic variables found to contribute the most for each model area shown here, panel A shows BIO4 (temperature seasonality, standard deviation *100), panel B shows BIO6 (minimum temperature of coldest month, °C), panel C shows BIO7 (temperature annual range, °C), pancel D shows BIO10 (mean temperature of warmest quarter, °C), panel E shows BIO 11 (mean temperature of coldest quarter, °C) and panel F shows BIO 14 (precipitation of driest month, mm). |