|
||
|
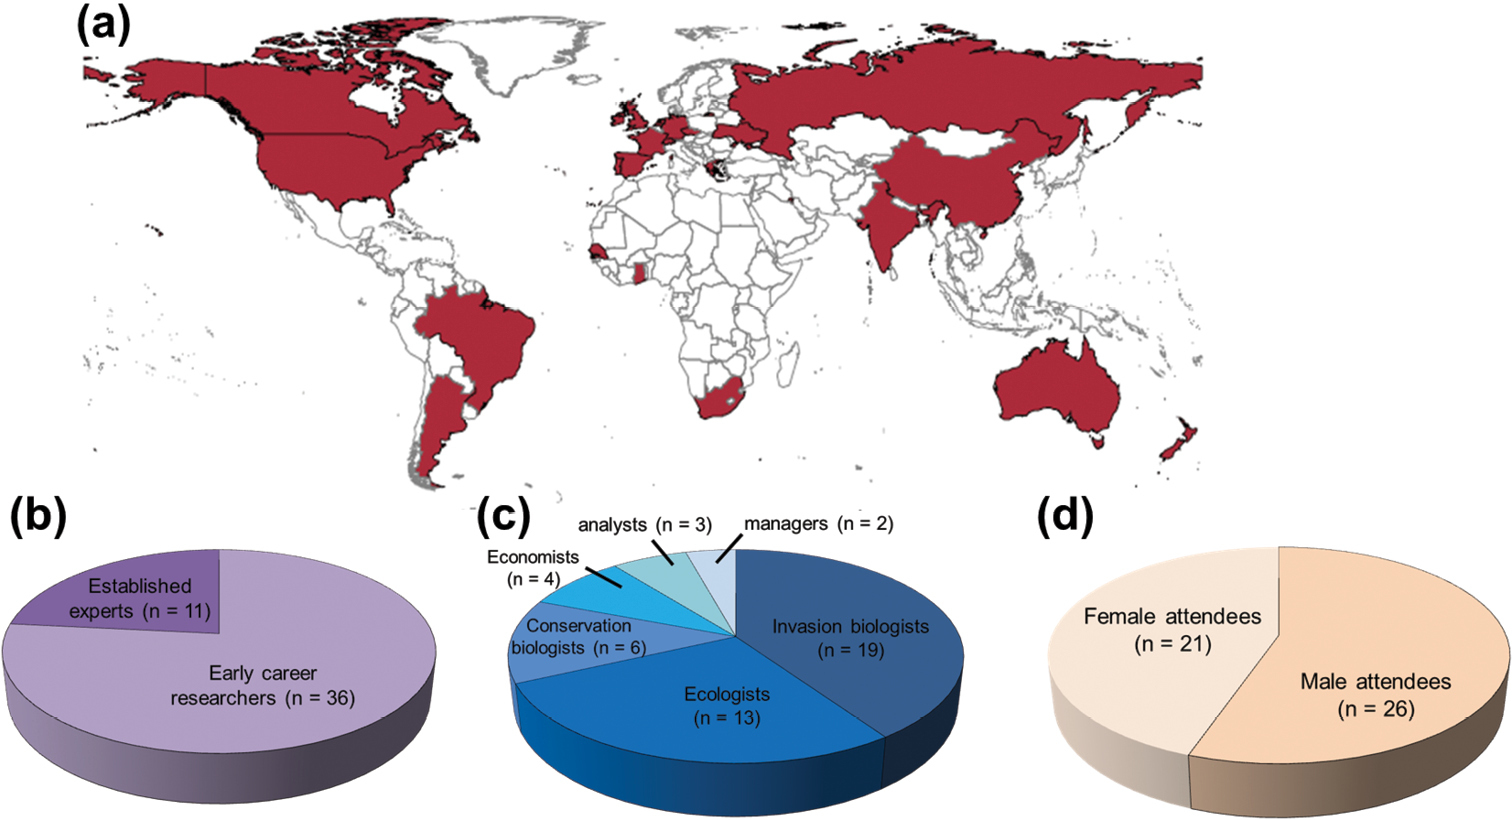
Graphical distribution of the attendees following their (a) nationality, (b) research experience, (c) working discipline and (d) gender. The different nationalities are represented by the countries highlighted in red (Argentina, Australia, Brazil, Canada, China, Czech Republic, France, Germany, Ghana, Greece, India, Ireland, Kuwait, Netherlands, New Zealand, Portugal, Russia, Senegal, South Africa, Spain, Switzerland, Ukraine, the United Kingdom and the United States). “n” represents the number of attendees. |