|
||
|
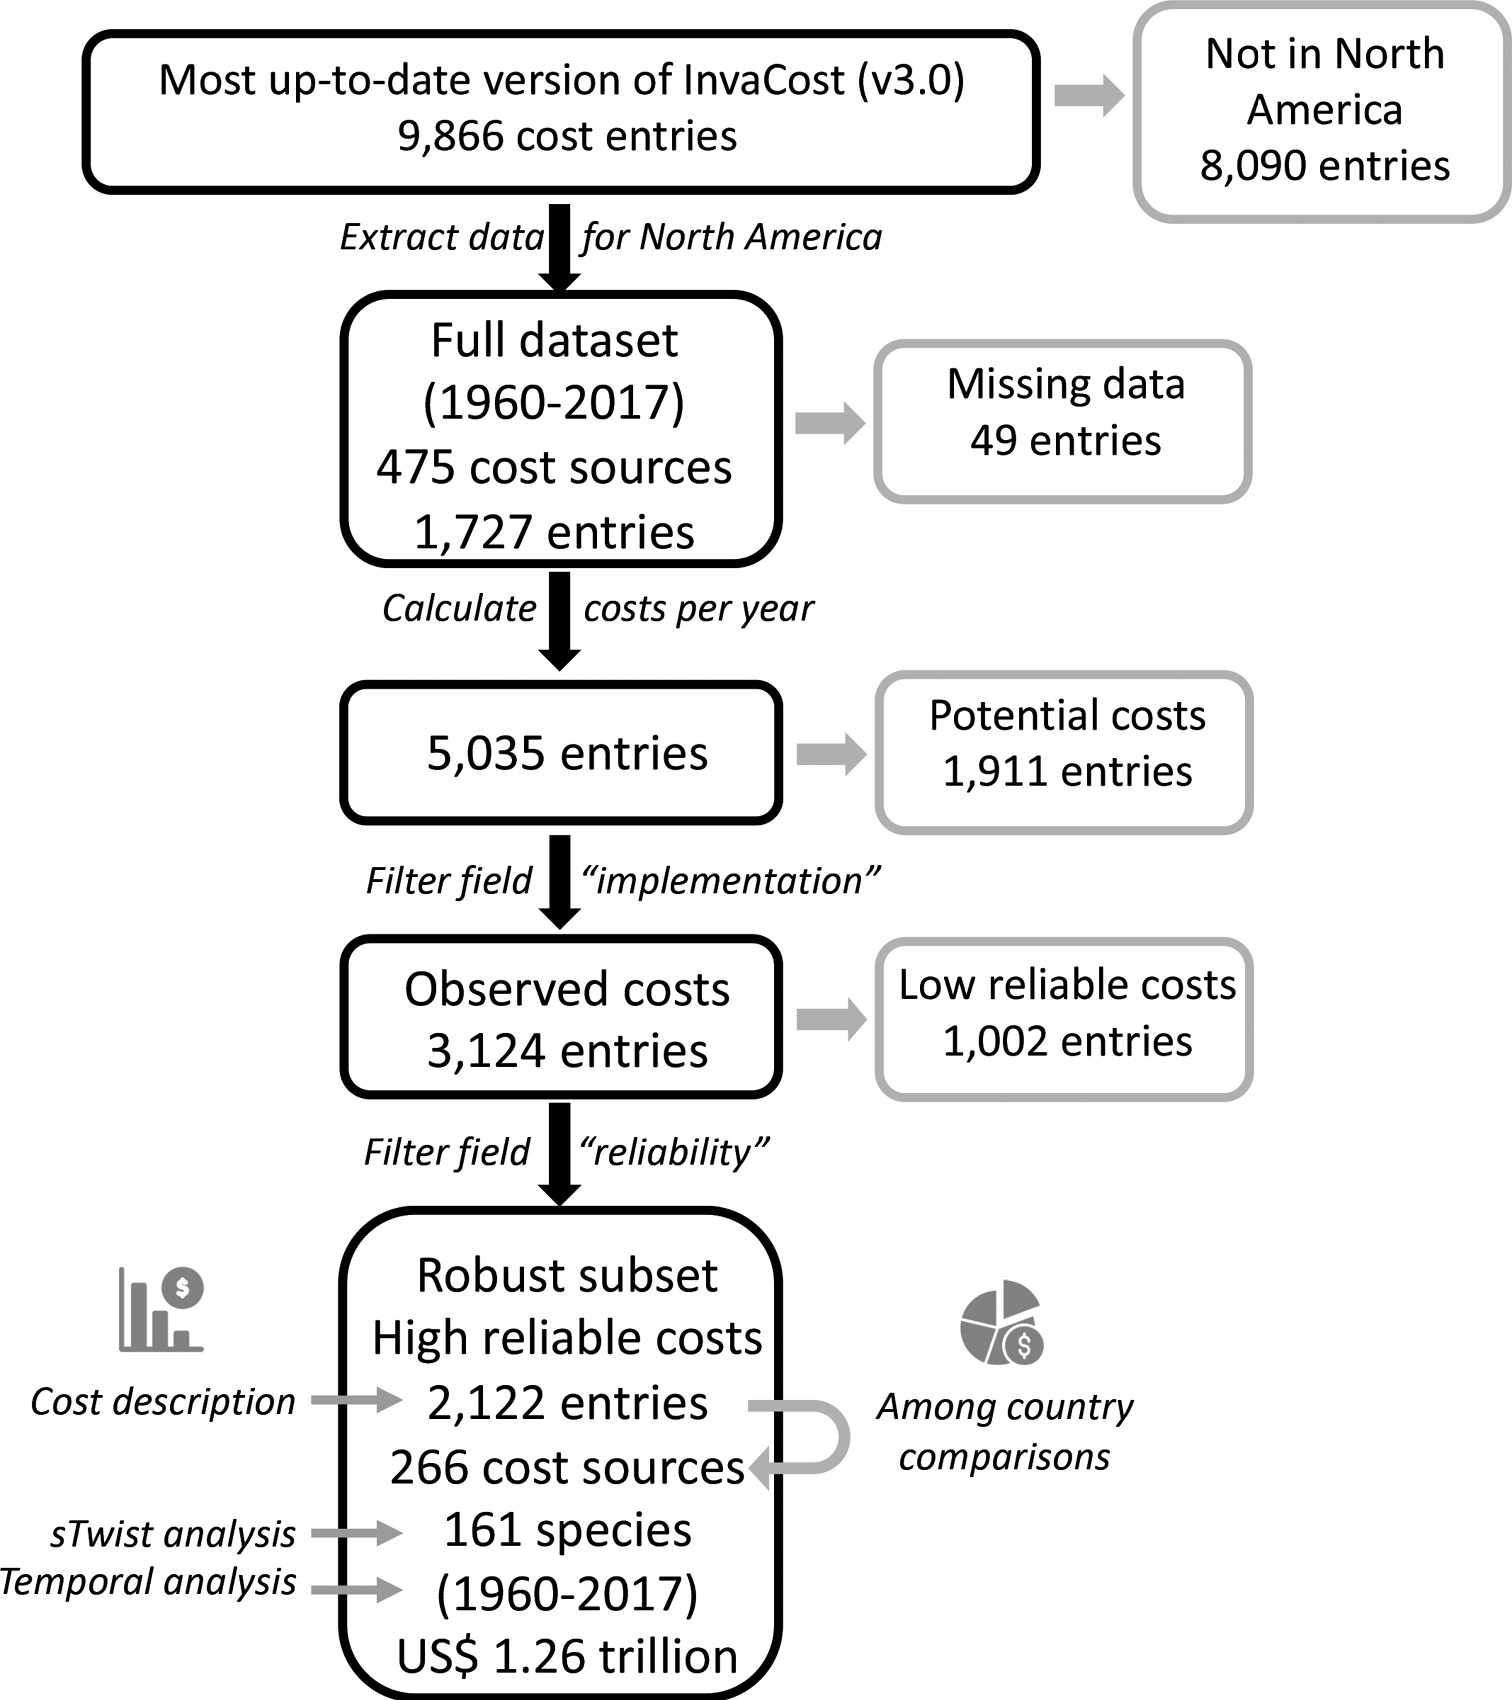
PRISMA flowchart (Moher et al. 2009) to depict our process for identifying the subset of economic data we used in this manuscript. Black boxes indicate the number of entries retained at every screening step. Gray boxes indicate the number of entries removed at every screening step. We began with 9,866 cost entries that include data from InvaCost 3.0 as well as recently collected data from invasion costs in Mexico (Rico-Sánchez et al. 2021) Ultimately, we retained 2,122 expanded entries that occurred within North America, and were classified as being reliable and directly observed. |