|
||
|
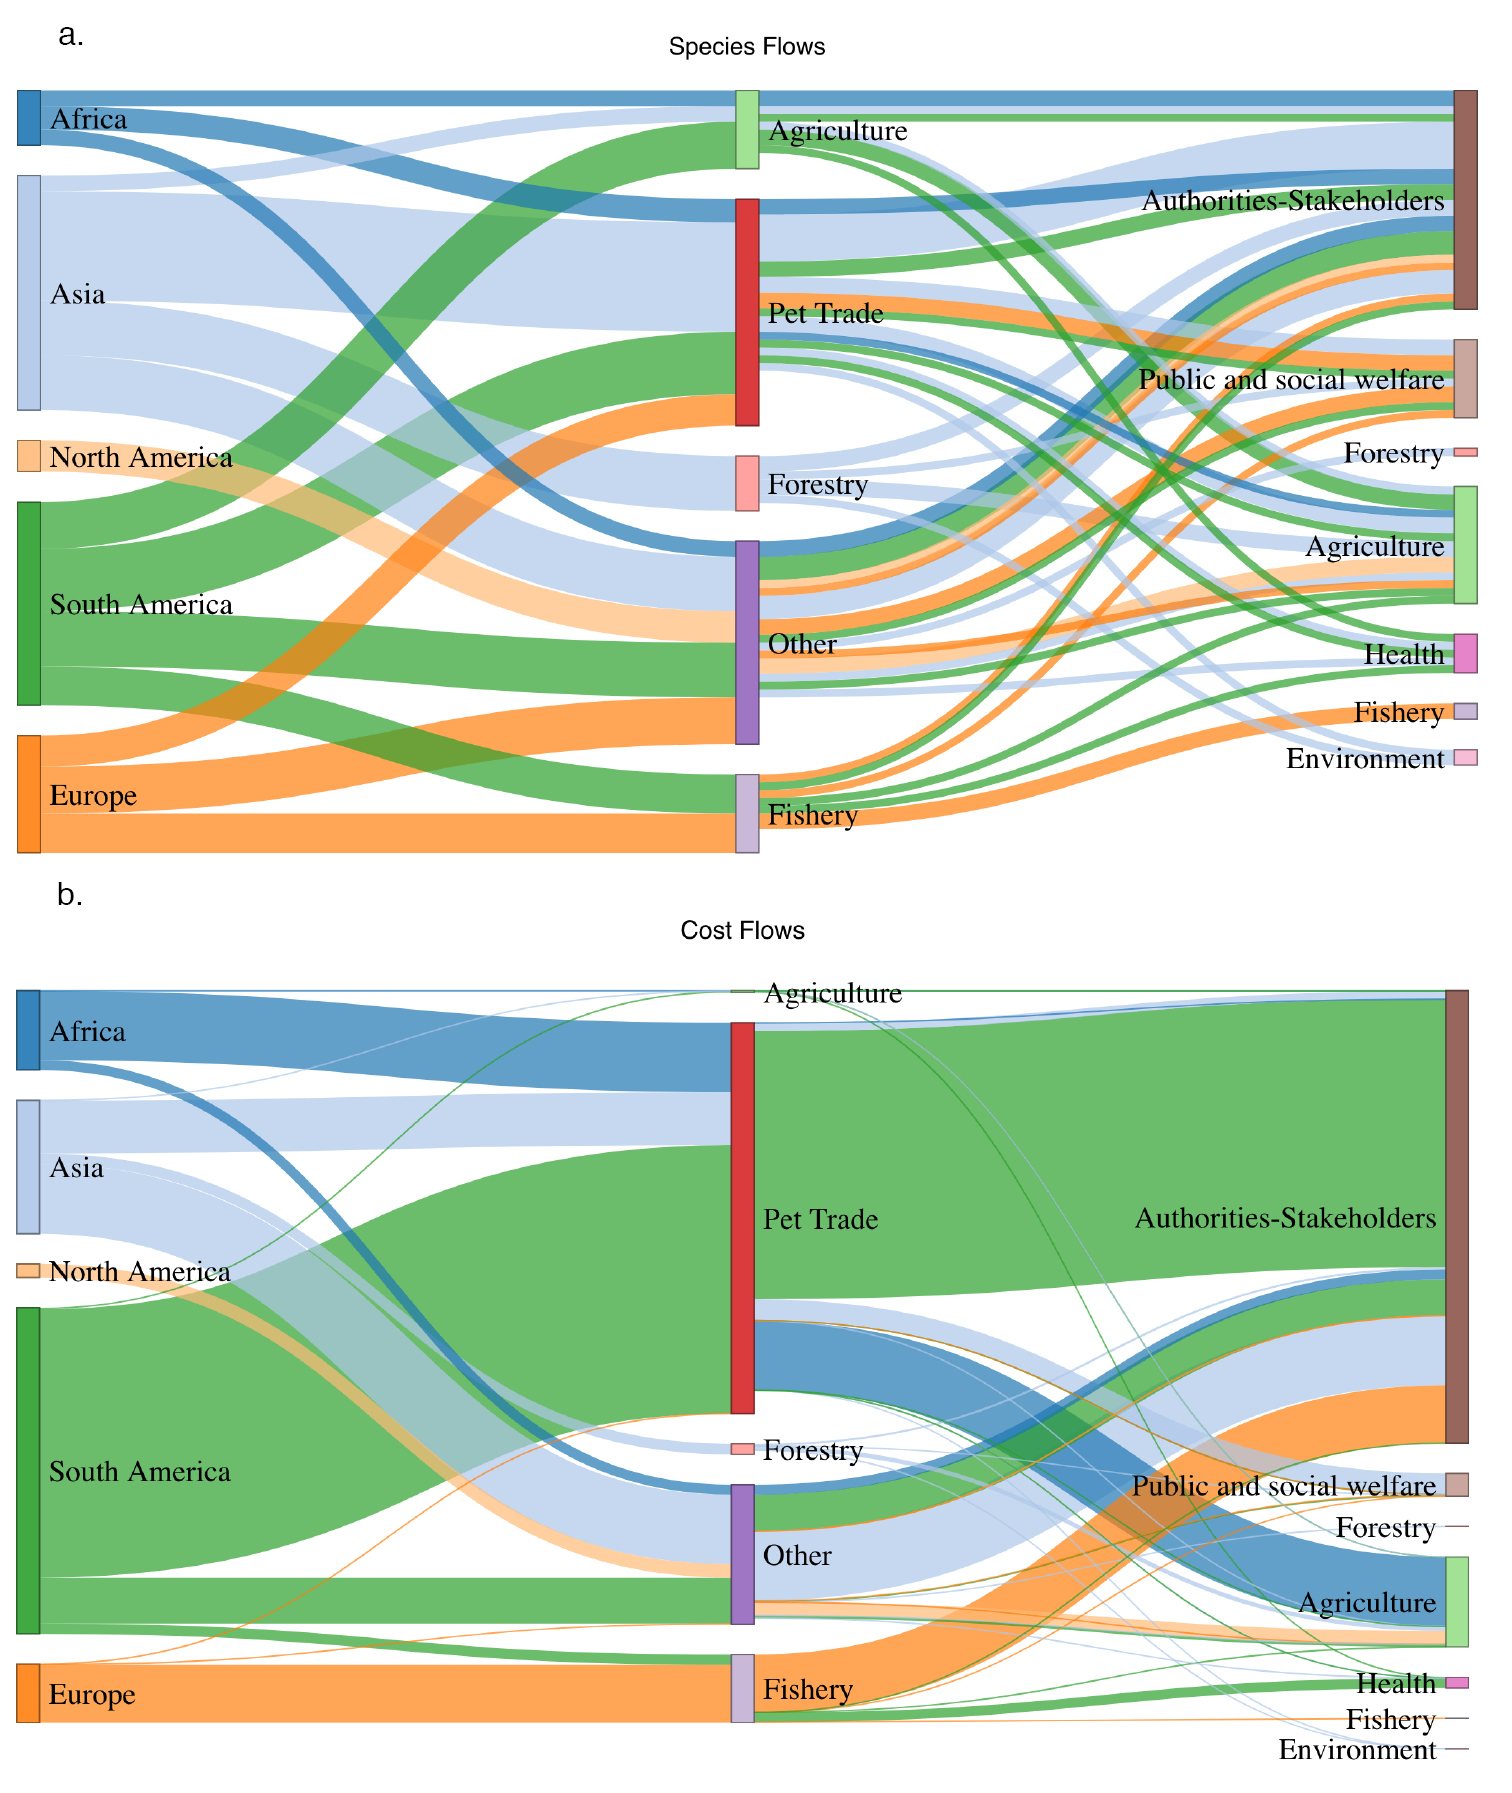
Flows from pathways of entry to impacted sectors proportional to a the number of species originating from each continent, and b the costs incurred estimated from our robust dataset (2017 US$). Originating nodes and colored flows in this diagram correspond to the continent of origin of each species when available from CABI. The center node labels correspond to dominant entry pathways characterized by CABI (n = 86 species with pathway information), while the destination node labels correspond to impacted sectors within the robust dataset. See Suppl. material 2: Fig. S2 for a more complete examination of flows, including diverse and unknown continents of origin, and impacts to multiple or unspecified sectors. |