|
||
|
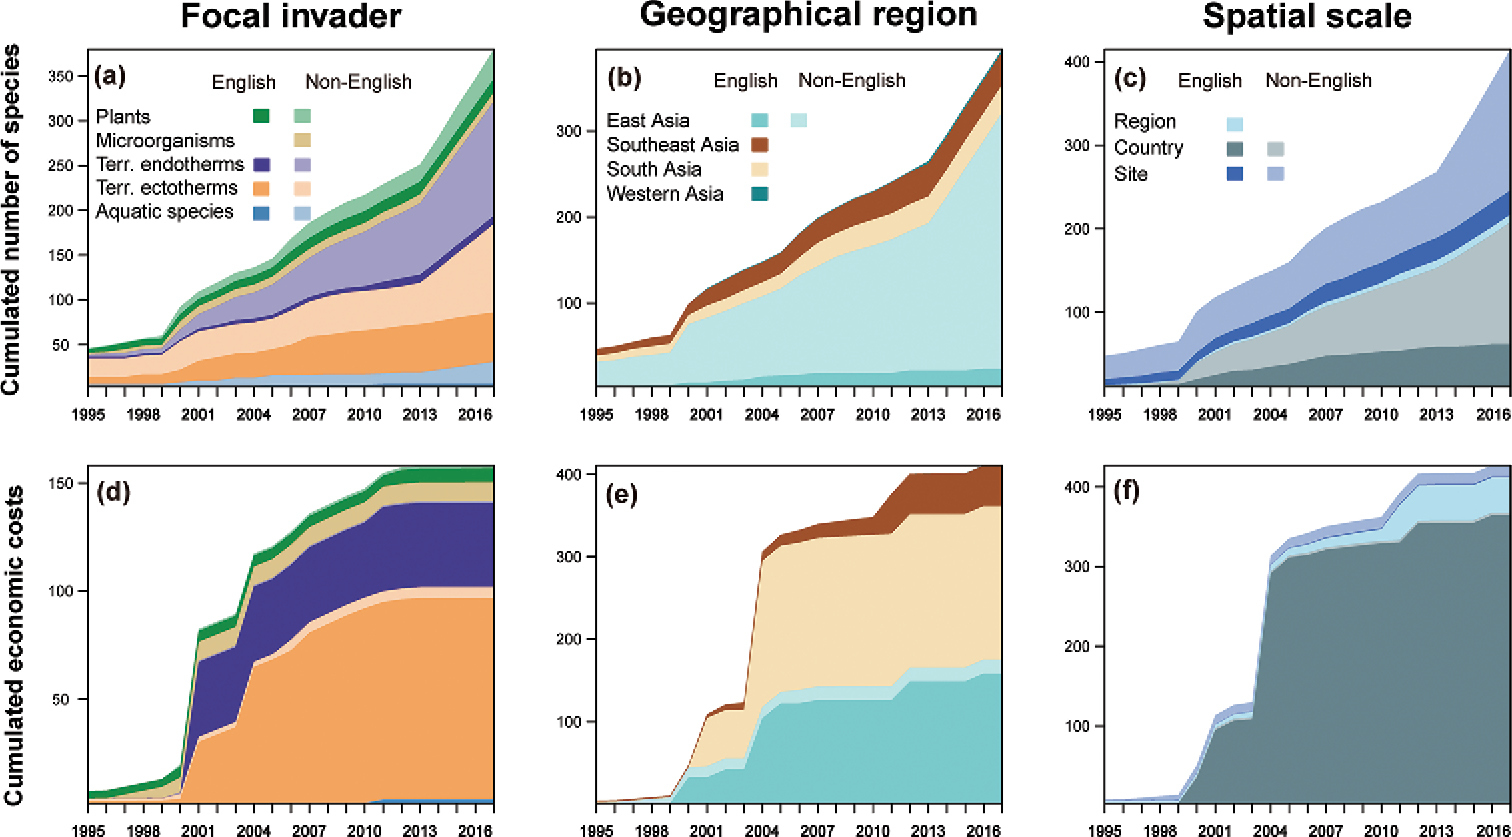
The temporal trends in the cumulated number of species and the amount of economic costs between 1995 and 2017. Focal invaders are classified into: Plants, Microorganisms, Terrestrial endotherms, Terrestrial ectotherms, and Aquatic species. Geographical regions are classified into: East Asia, Southeast Asia, South Asia, and Western Asia. Spatial scales are classified into: Region, Country, and Site. Economic costs are standardized in US billion dollars (2017 value). Note that the contribution of each group at a point in time is represented by the proportionate height width (not the absolute height) of the corresponding color at that particular year. Given some cost data cannot be classified into specific groups of invaders or geographical regions, the number of species and economic costs are different between panels. One species can be estimated in different years and/or different publications. The temporal scale is set since 1995, because economic costs are rarely estimated between 1965 and 1995 (see Results for more details). |