|
||
|
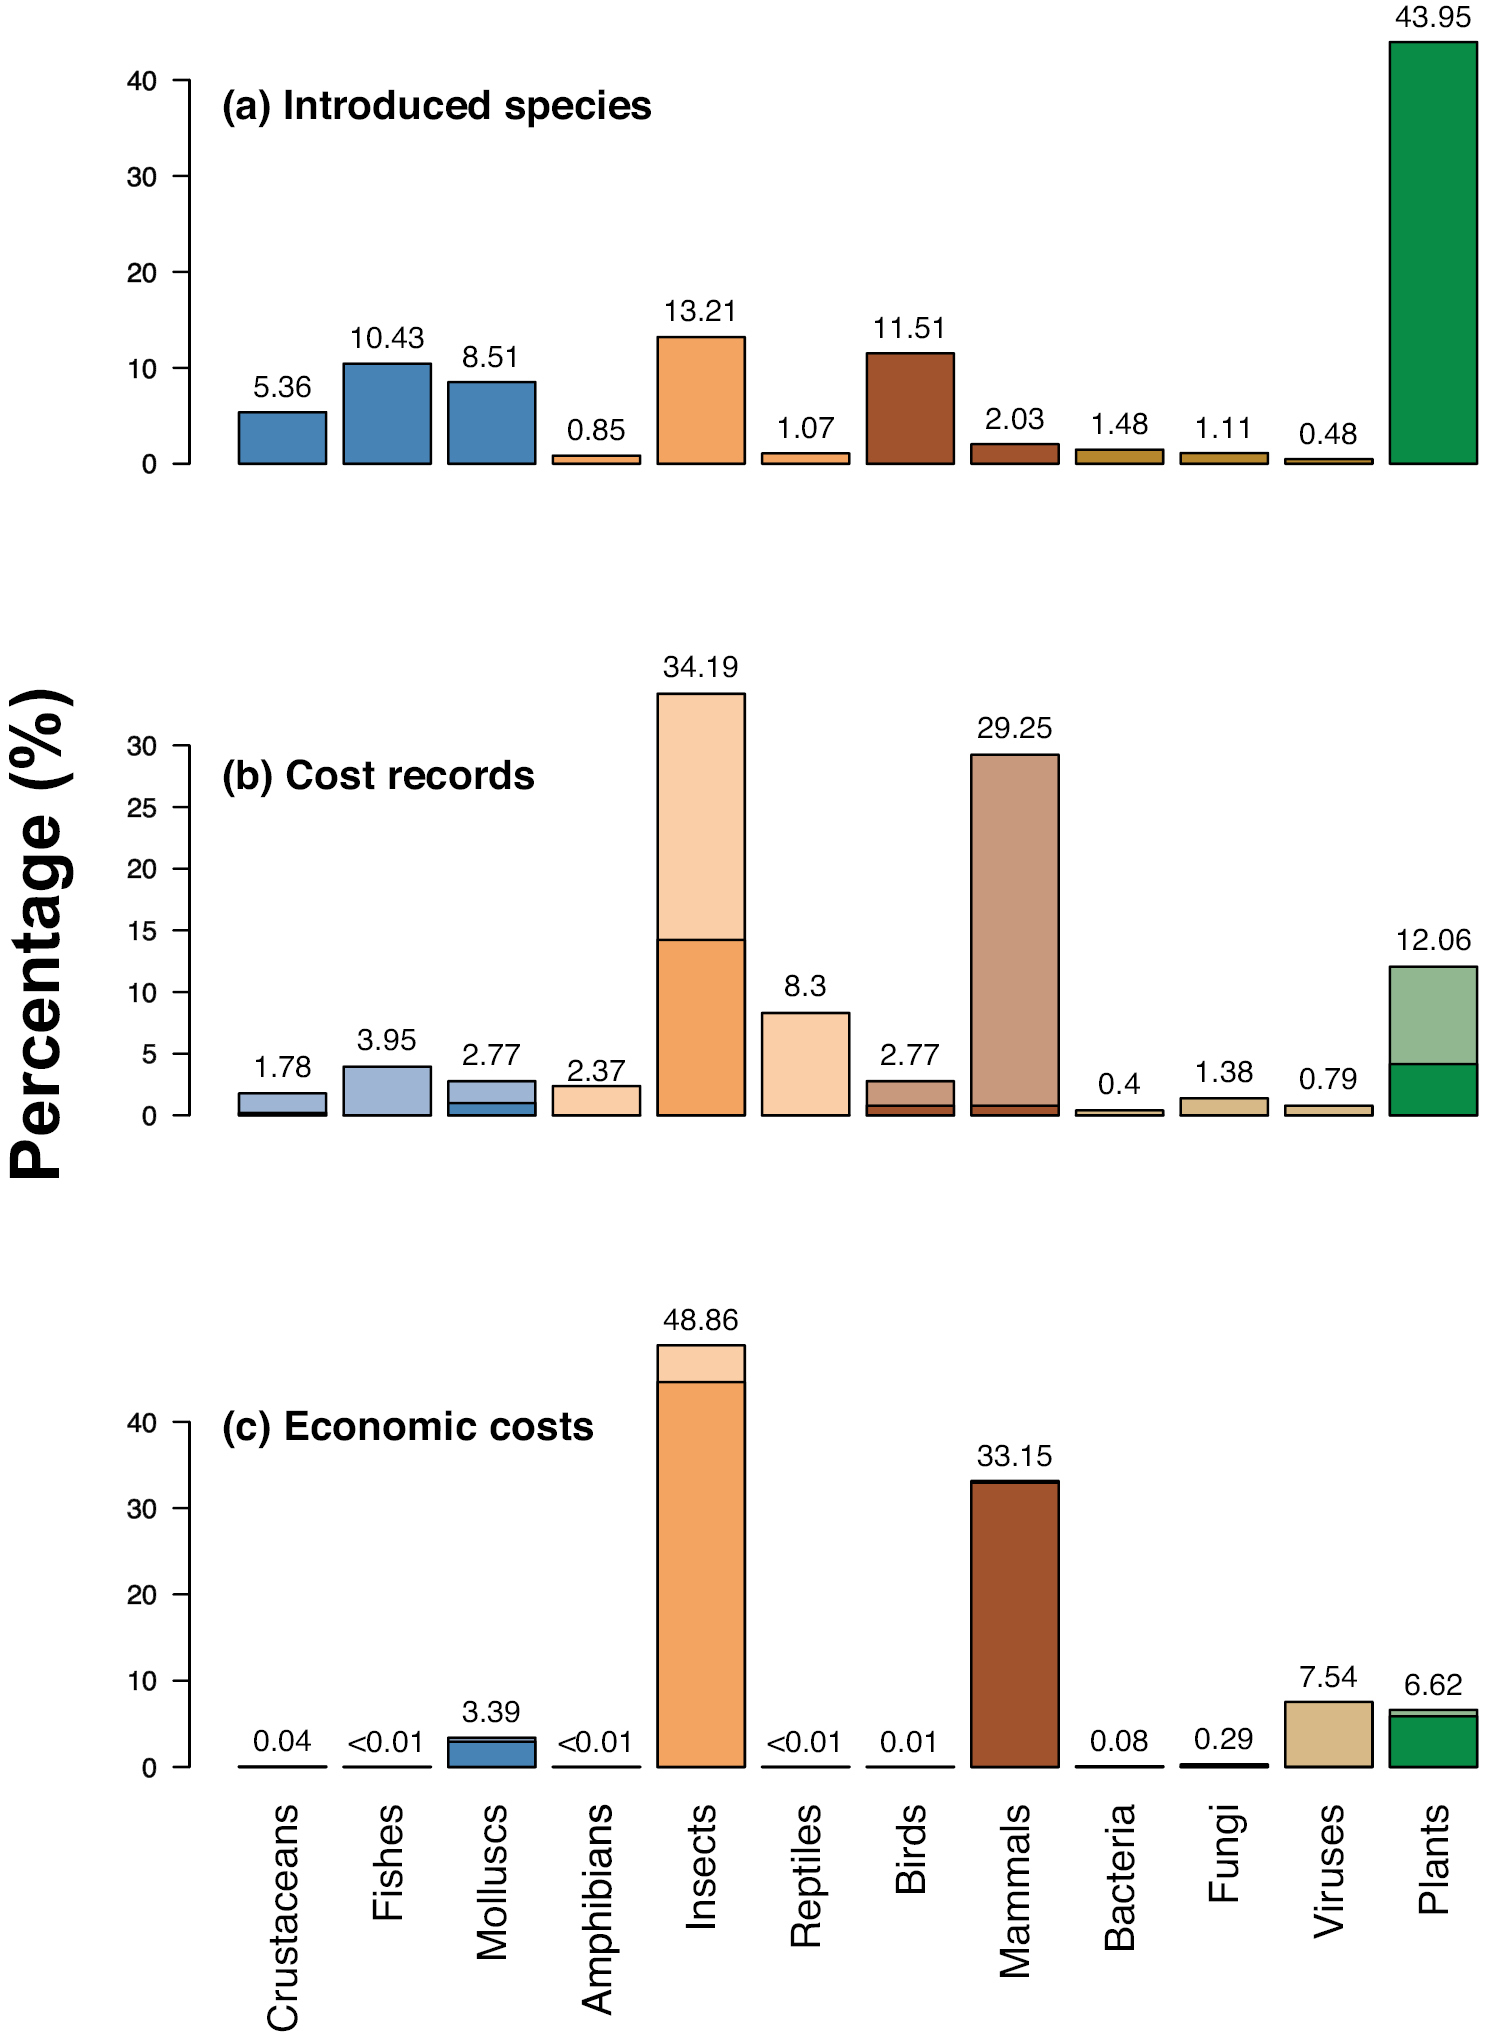
The compositions of (a) species introduced in Asia (b) species with estimated economic costs, and (c) economic costs across 12 taxonomic groups. Data retrieved from English studies are shown in a darker shade and those from non-English studies are in a lighter shade. The percentage of each taxonomic group is shown above the bar. Colors of taxonomic groups correspond to colors of five ecological groups shown in Figure 1. Data of (a) are from the Global Alien Species First Records Database, while data of (b) and (c) from our dataset. |