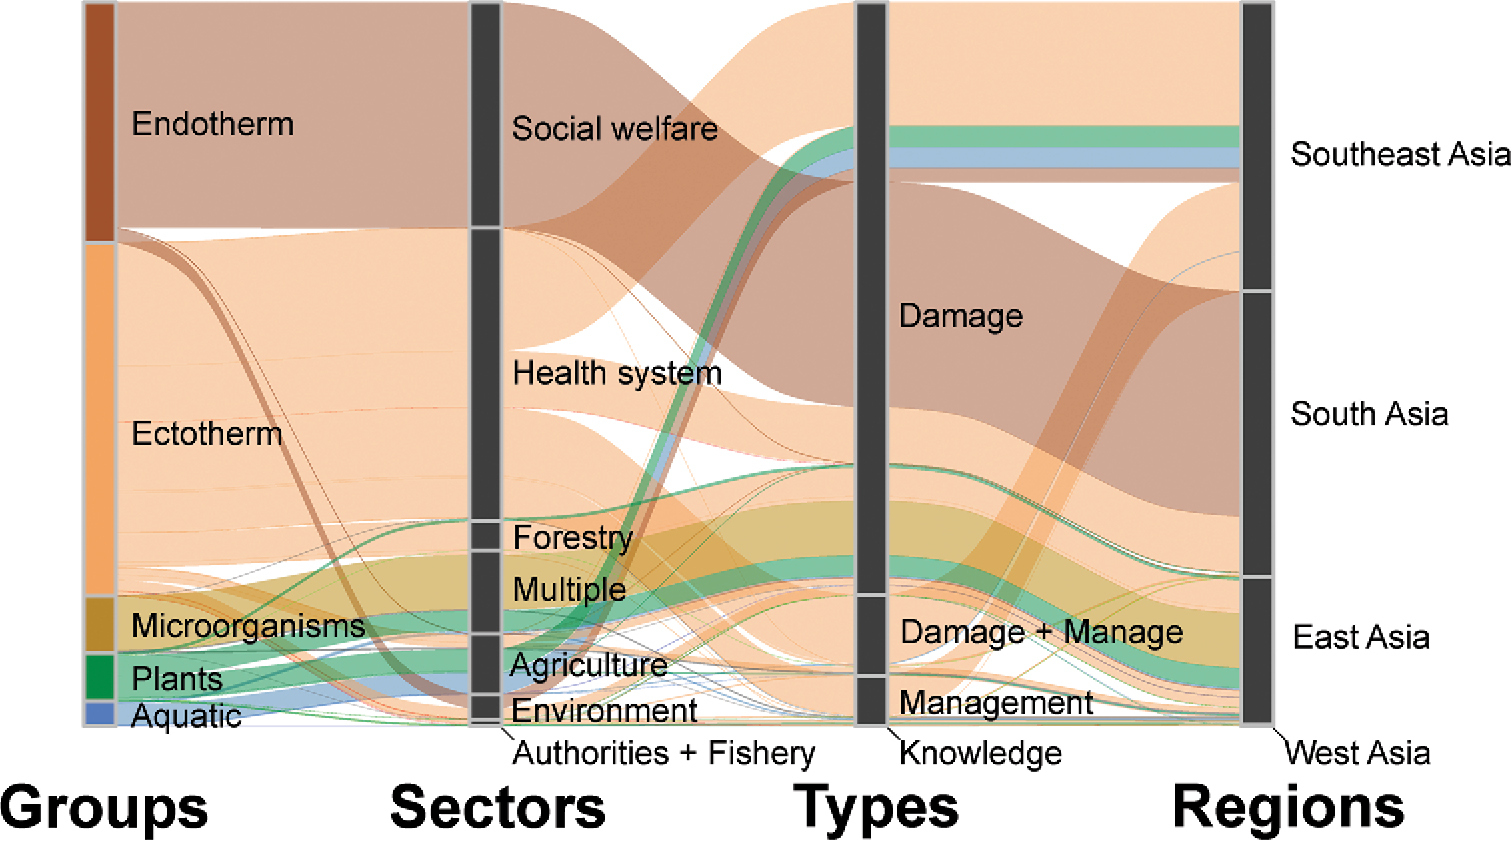
The network showing the composition of economic costs among ecological groups, impacted sectors, types of cost and geographical regions. Only economic costs estimated for particular species were considered, and those estimated for multiple species were excluded. Colors of ecological groups correspond to colors of five ecological groups shown in Figure 1.


  Part of: Liu C, Diagne C, Angulo E, Banerjee A-K, Chen Y, Cuthbert RN, Haubrock PJ, Kirichenko N, Pattison Z, Watari Y, Xiong W, Courchamp F (2021) Economic costs of biological invasions in Asia. In: Zenni RD, McDermott S, GarcĂ­a-Berthou E, Essl F (Eds) The economic costs of biological invasions around the world. NeoBiota 67: 53-78. https://doi.org/10.3897/neobiota.67.58147