|
||
|
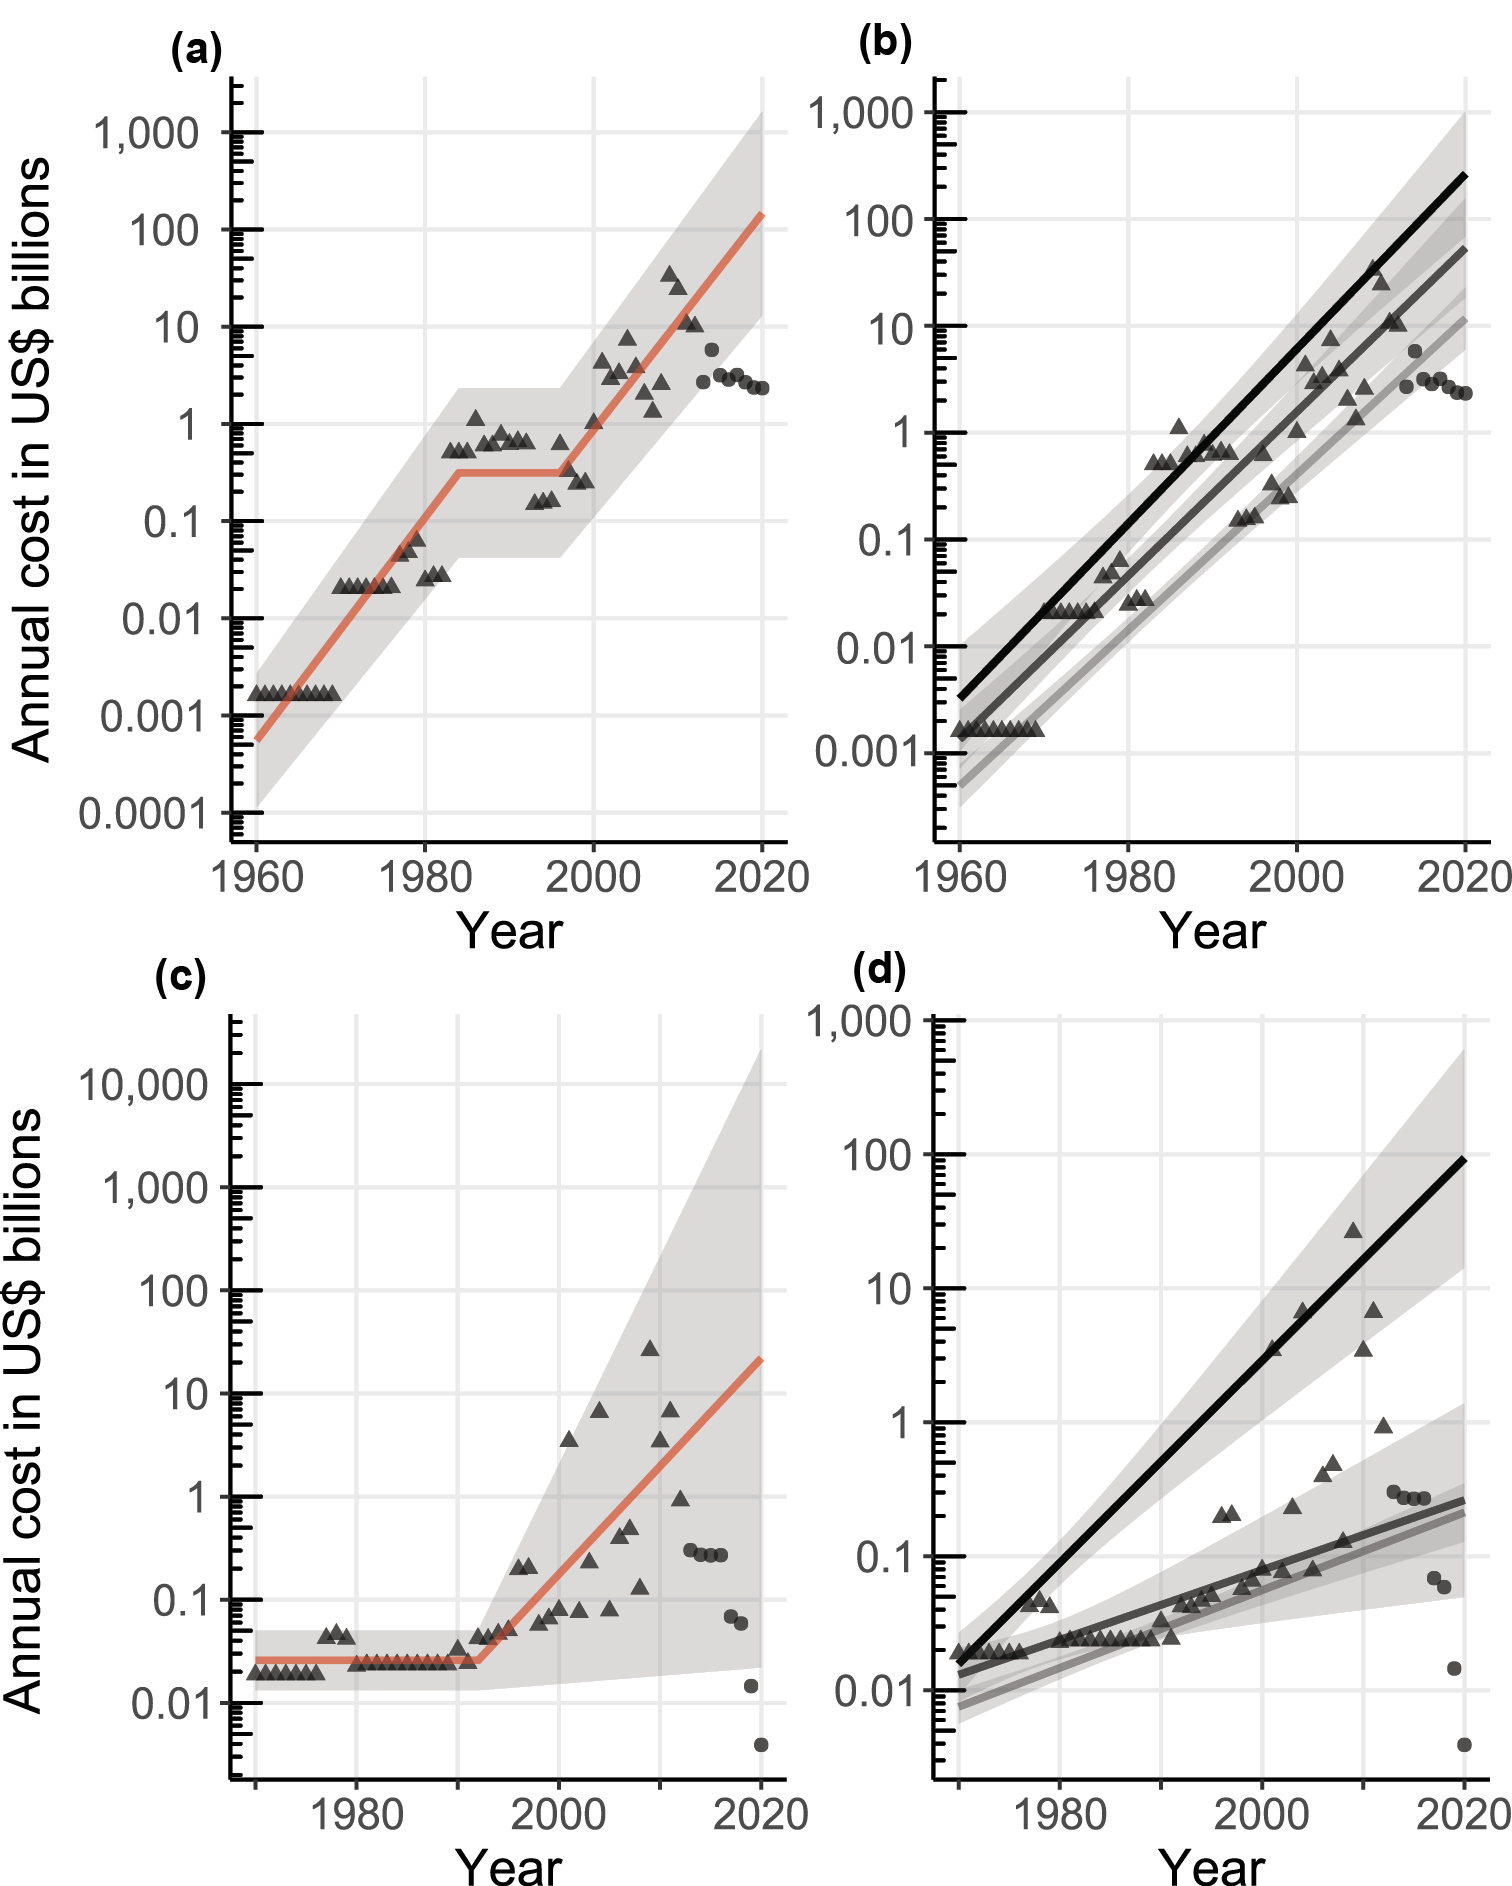
Temporal trend of total annual invasion costs recorded in Europe according to multivariate adaptive regression splines (MARS) (a red) and quantile regressions; from bottom to top: 0.1: light grey, 0.5: grey, 0.9: dark grey (b) between 1960 and 2020, as well as reliable observed costs, MARS (c red) and quantile regressions; from bottom to top: 0.1: light grey, 0.5: grey, 0.9: dark grey (d) between 1970 and 2020. Error bands on MARS represent prediction intervals (i.e. the interval of cost that any individual year can have). Error bands on quantile regressions represent 95% confidence intervals. Yearly data are triangles (until 2013) and circles (after); only the former are used in the models. |