|
||
|
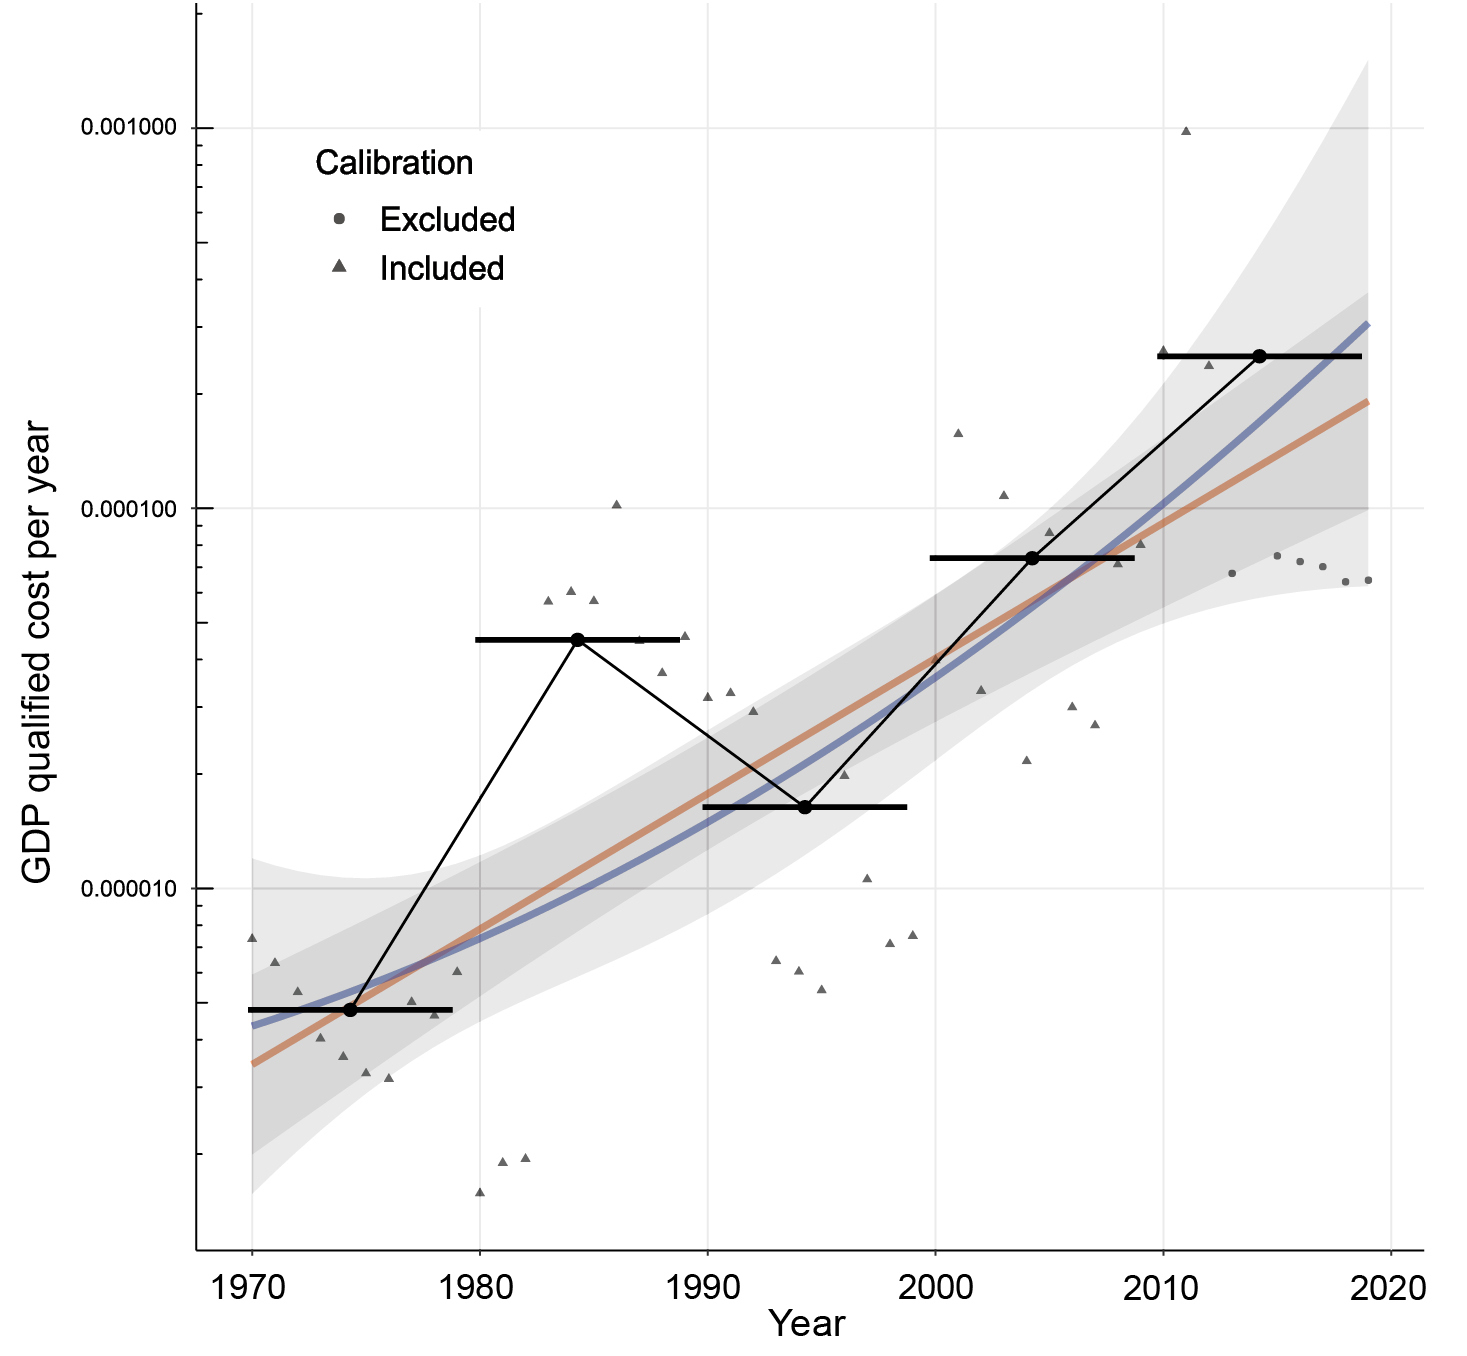
Temporal trend of costs considering the GDP-standardized average decadal costs (black bars) and total annual GDP-standardized invasion costs (triangles until 2013, circles after) recorded in Europe (on a log scale). Robust regression analysis between 1970 (the first year of documented reliable observed costs) and 2019 (last year with available GDP data) is overlaid, showing linear regression in orange and quadratic regression in blue. Error bands on robust regressions represent 95% confidence intervals. Model coefficients are presented in Suppl. material 7. |