|
||
|
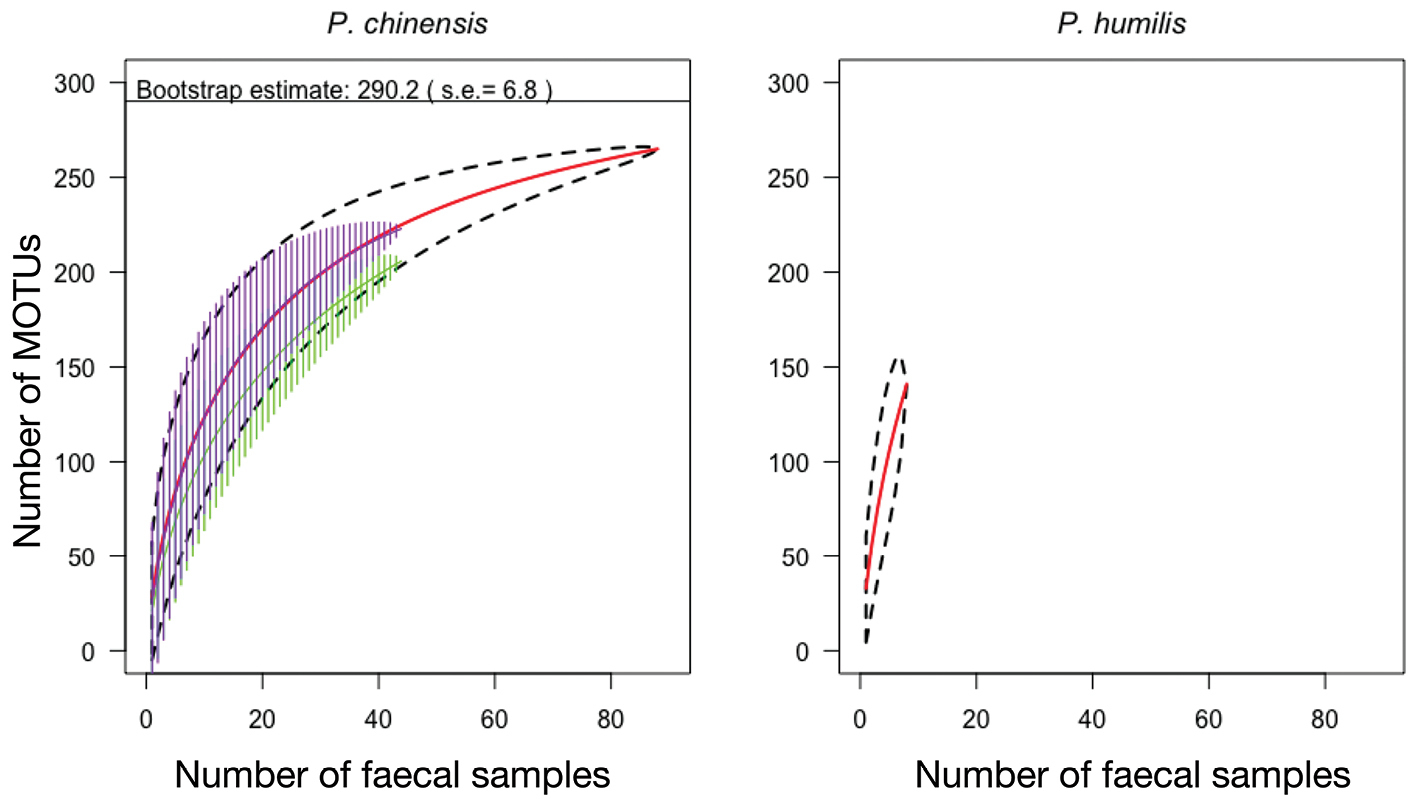
Detection of prey MOTUs in the faeces of wasp larvae. Cumulative curves of number of invertebrate prey MOTUs in relation to number of samples. Left: P. chinensis, right: P. humilis. Cumulative curves are in red, the area delimited by the dashed lines corresponds to the 95% confidence interval. On the left, the horizontal solid line represents the estimated total number of prey MOTUs in the diet of P. chinensis. The purple and green hatched areas correspond to cumulative curves obtained with inner and outer samples, respectively. |