|
||
|
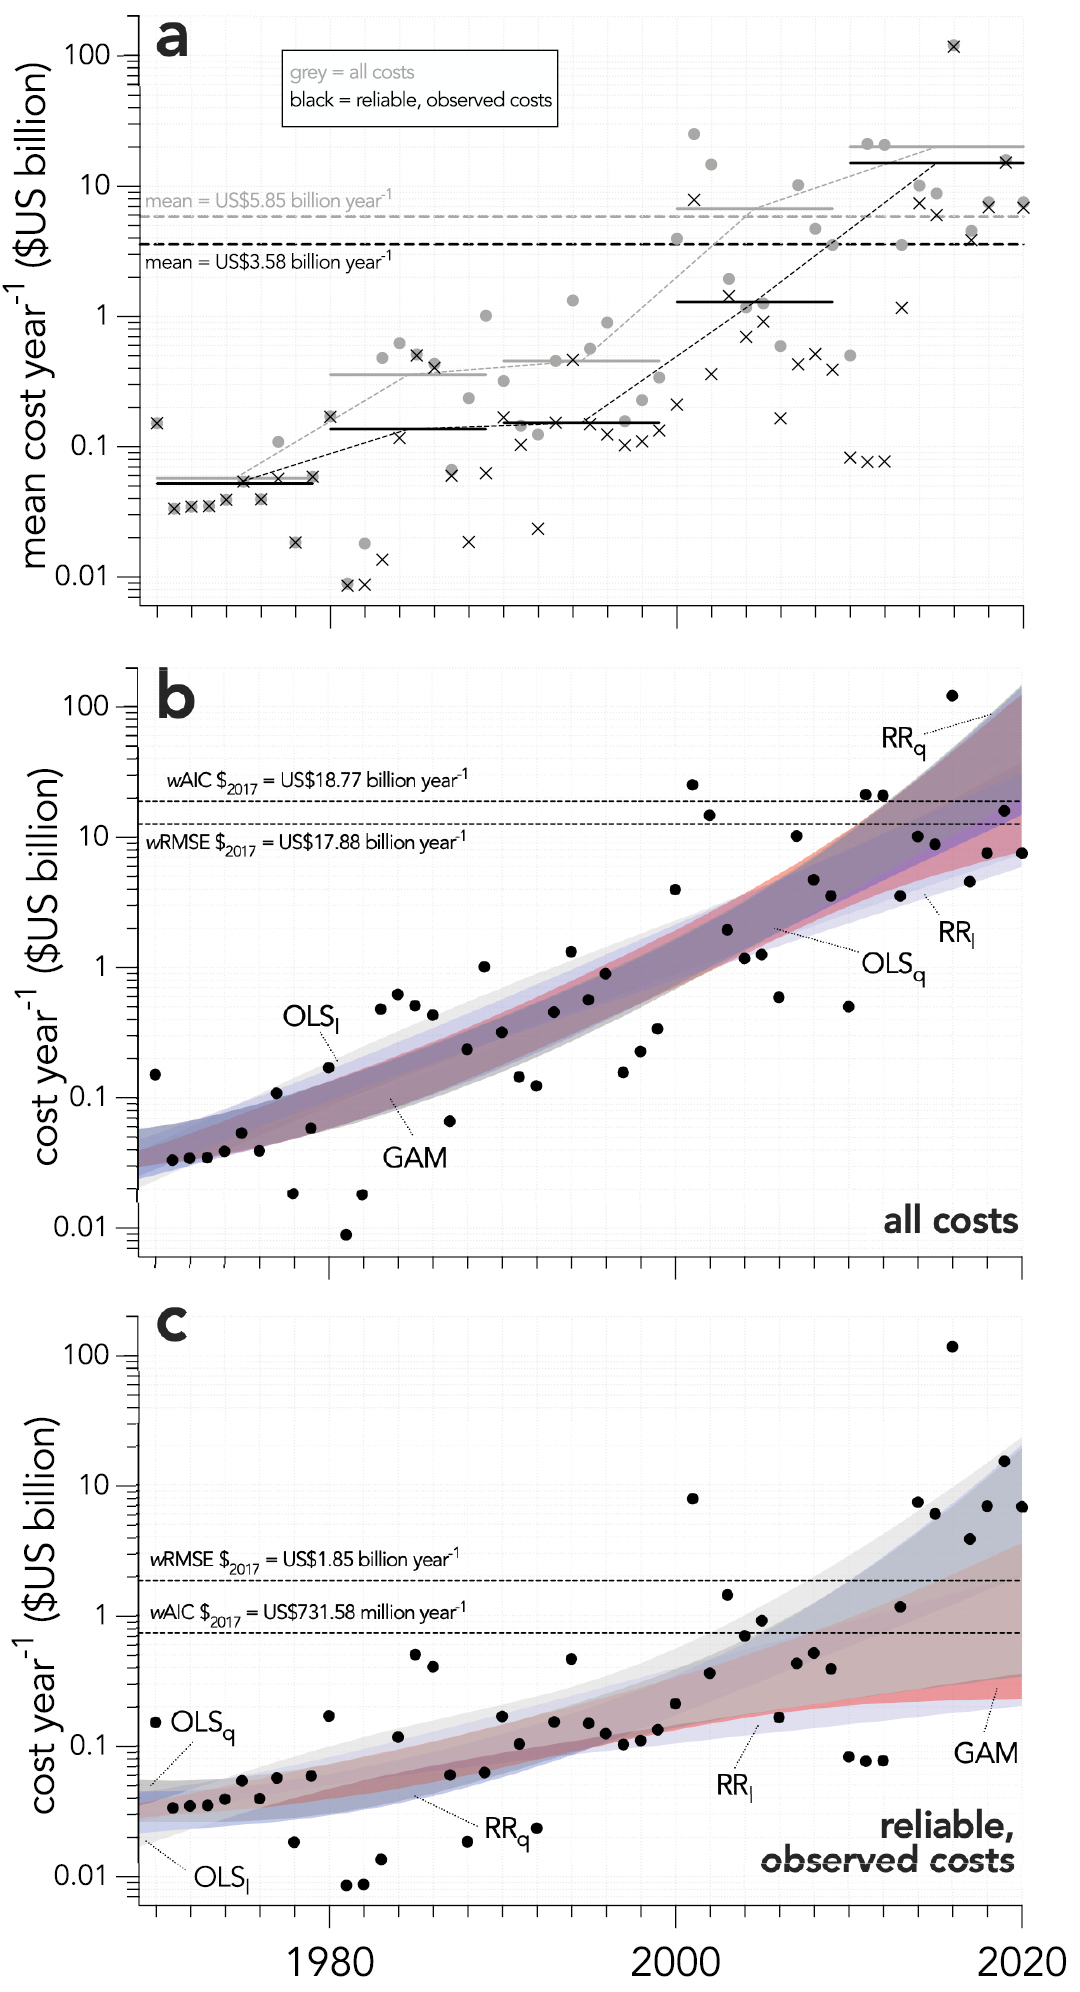
a raw annual costs for all costs (black) and reliable, observed costs (grey). Also shown are the decadal and overall means b predicted annual costs across Australia from 1970 to 2020 for all costs and c reliable, observed costs only. Fitted models include OLSl = linear ordinary least-squares, OLSq = quadratic ordinary least-squares, RRl = linear robust regression, RRq = quadratic robust regression, GAM = general additive model. Also shown in each panel are wAIC $2017 = Akaike’s information criterion-weighted (wAIC)-average of the predicted annual cost in 2017 (all costs; OLSl, OLSq, GAM only), wRMSE $2017 = root mean-squared error-weighted average of the predicted annual cost in 2017 (all costs; all models), wAIC $2017, and wRMSE $2017 (reliable, observed costs only). |