|
||
|
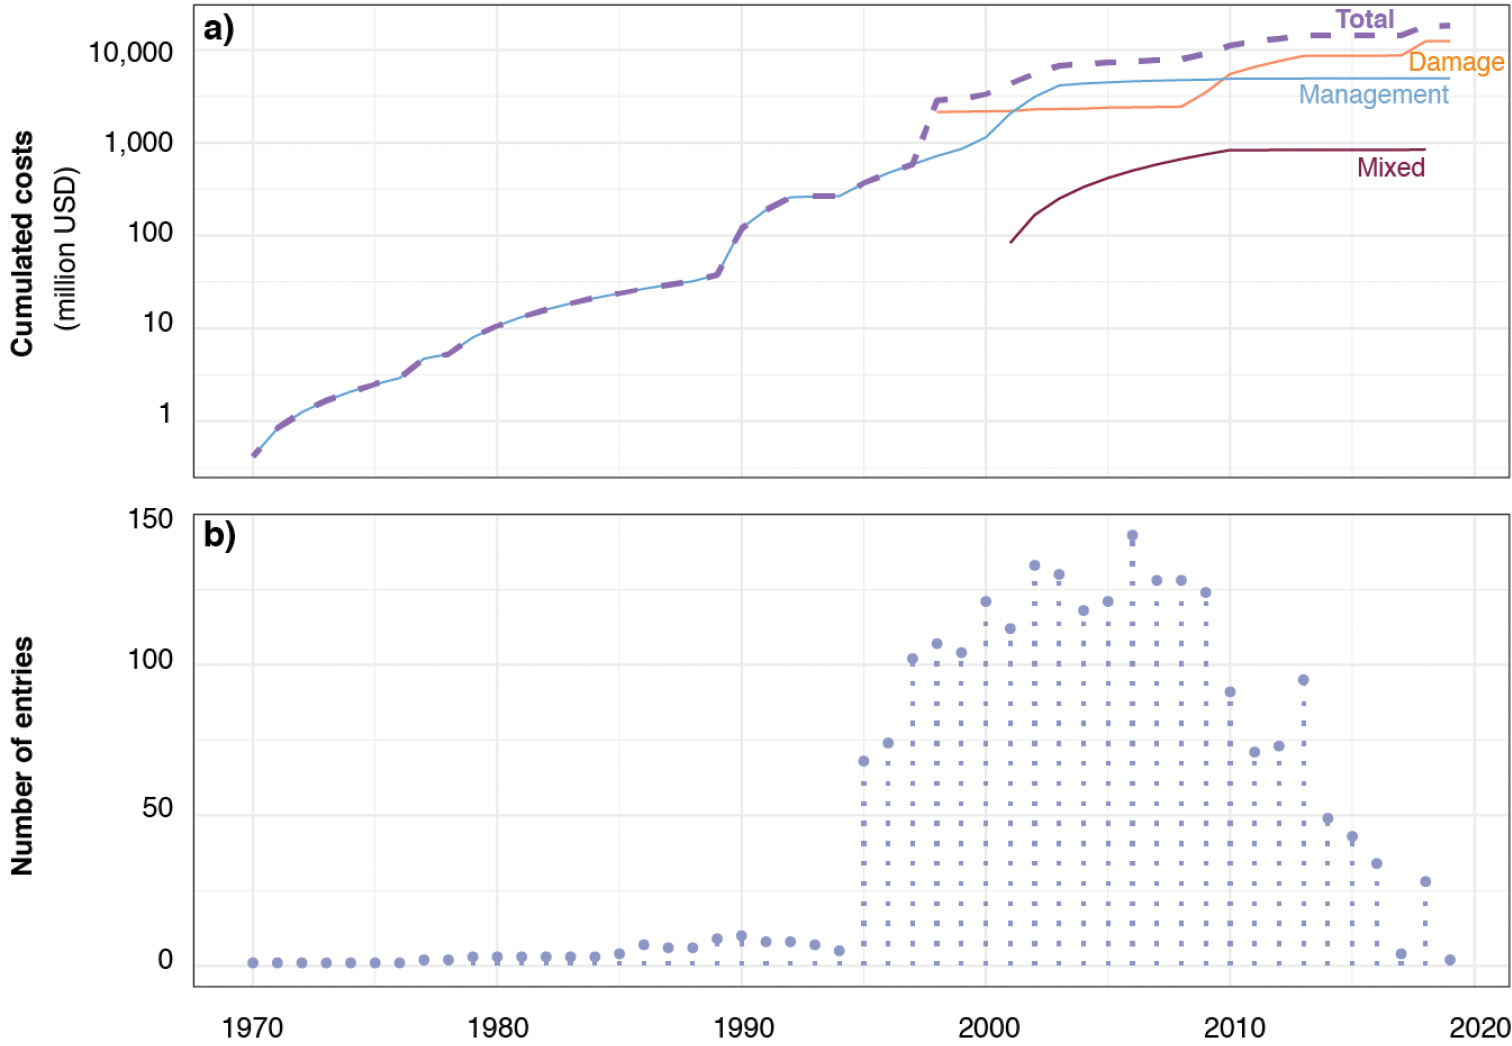
Distribution of cost estimates over time represented by a the cumulative cost amounts and b the number of cost entries per year between 1970 and 2019. We considered the expanded version of the starting dataset. In a the dashed line corresponds to the total amounts over the complete period, while the other lines correspond to the amounts of damage losses, management expenditures and mixed costs (i.e. when costs could not be exclusively associated with ‘damage’ or ‘management’ type). |