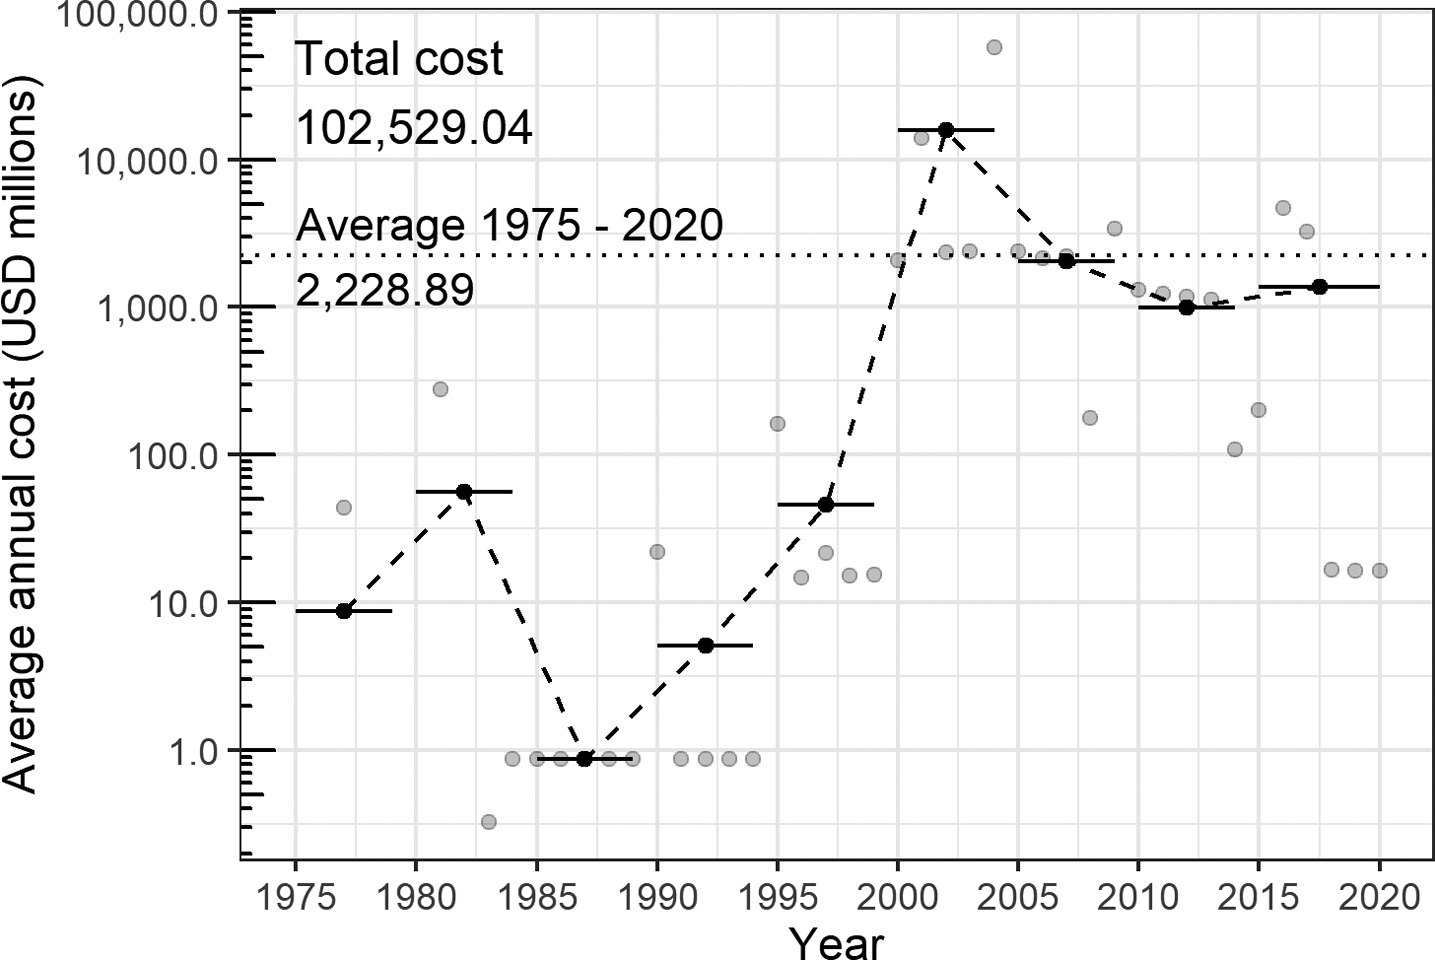
Annual costs of biological invasions observed over time in Central and South America. Grey dots represent the annual costs, horizontal lines and black dots represent the average annual cost per 5 years and the dashed horizontal line represents the general average between 1975 and 2020.


  Part of: Heringer G, Angulo E, Ballesteros-Mejia L, Capinha C, Courchamp F, Diagne C, Duboscq-Carra VG, Nuñez MA, Zenni RD (2021) The economic costs of biological invasions in Central and South America: a first regional assessment. In: Zenni RD, McDermott S, García-Berthou E, Essl F (Eds) The economic costs of biological invasions around the world. NeoBiota 67: 401-426. https://doi.org/10.3897/neobiota.67.59193