|
||
|
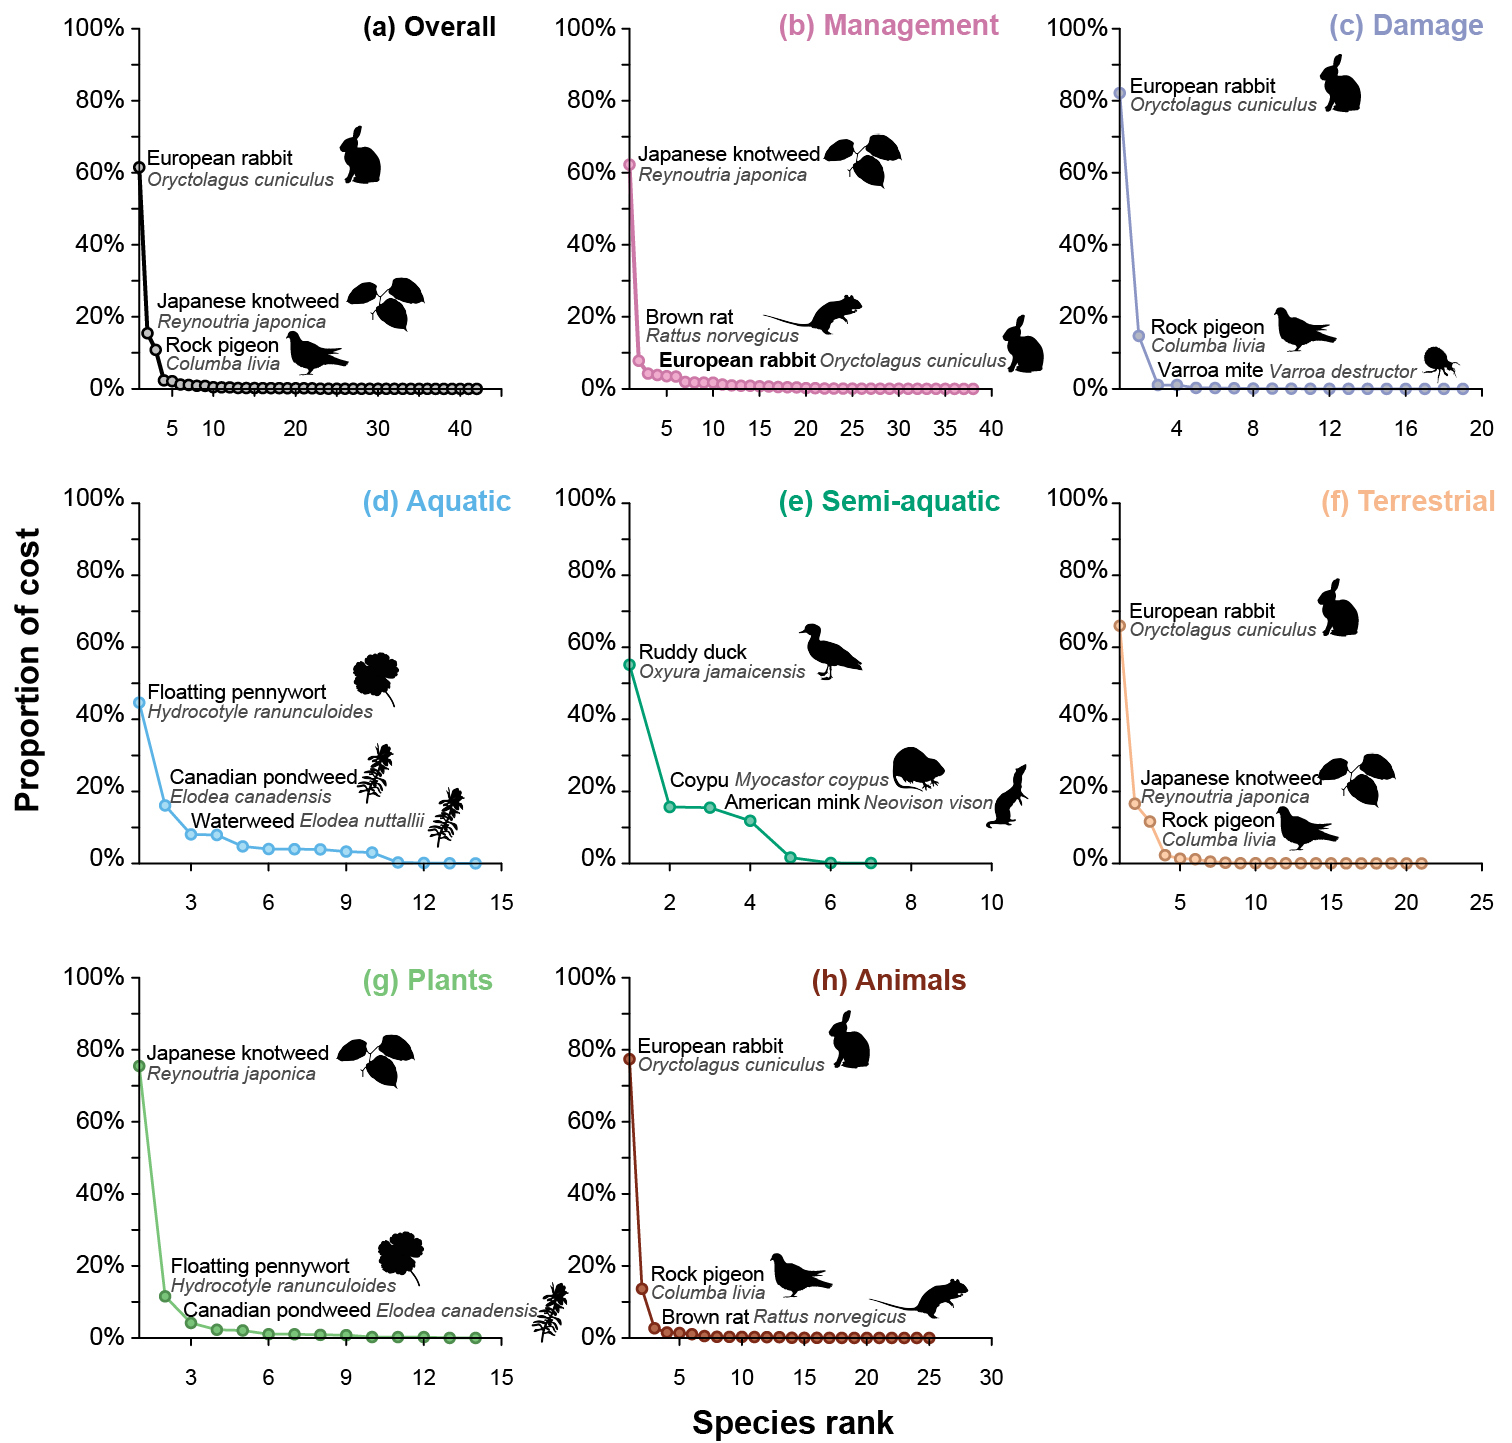
Whittaker plots illustrating ranked proportional cost contributions across species for a overall b management c damage d aquatic e semi-aquatic f terrestrial g plant and h animal cost categories. The top three highest-contributing species are labelled on each subplot, for example, the European rabbit ranks as the costliest species a overall, for c damage costs and amongst the terrestrial organisms (f) and animal kingdom (h), representing 62%, 82%, 66% and 77% of costs in the respective categories. Note the differences in x-axes scaling. |