|
||
|
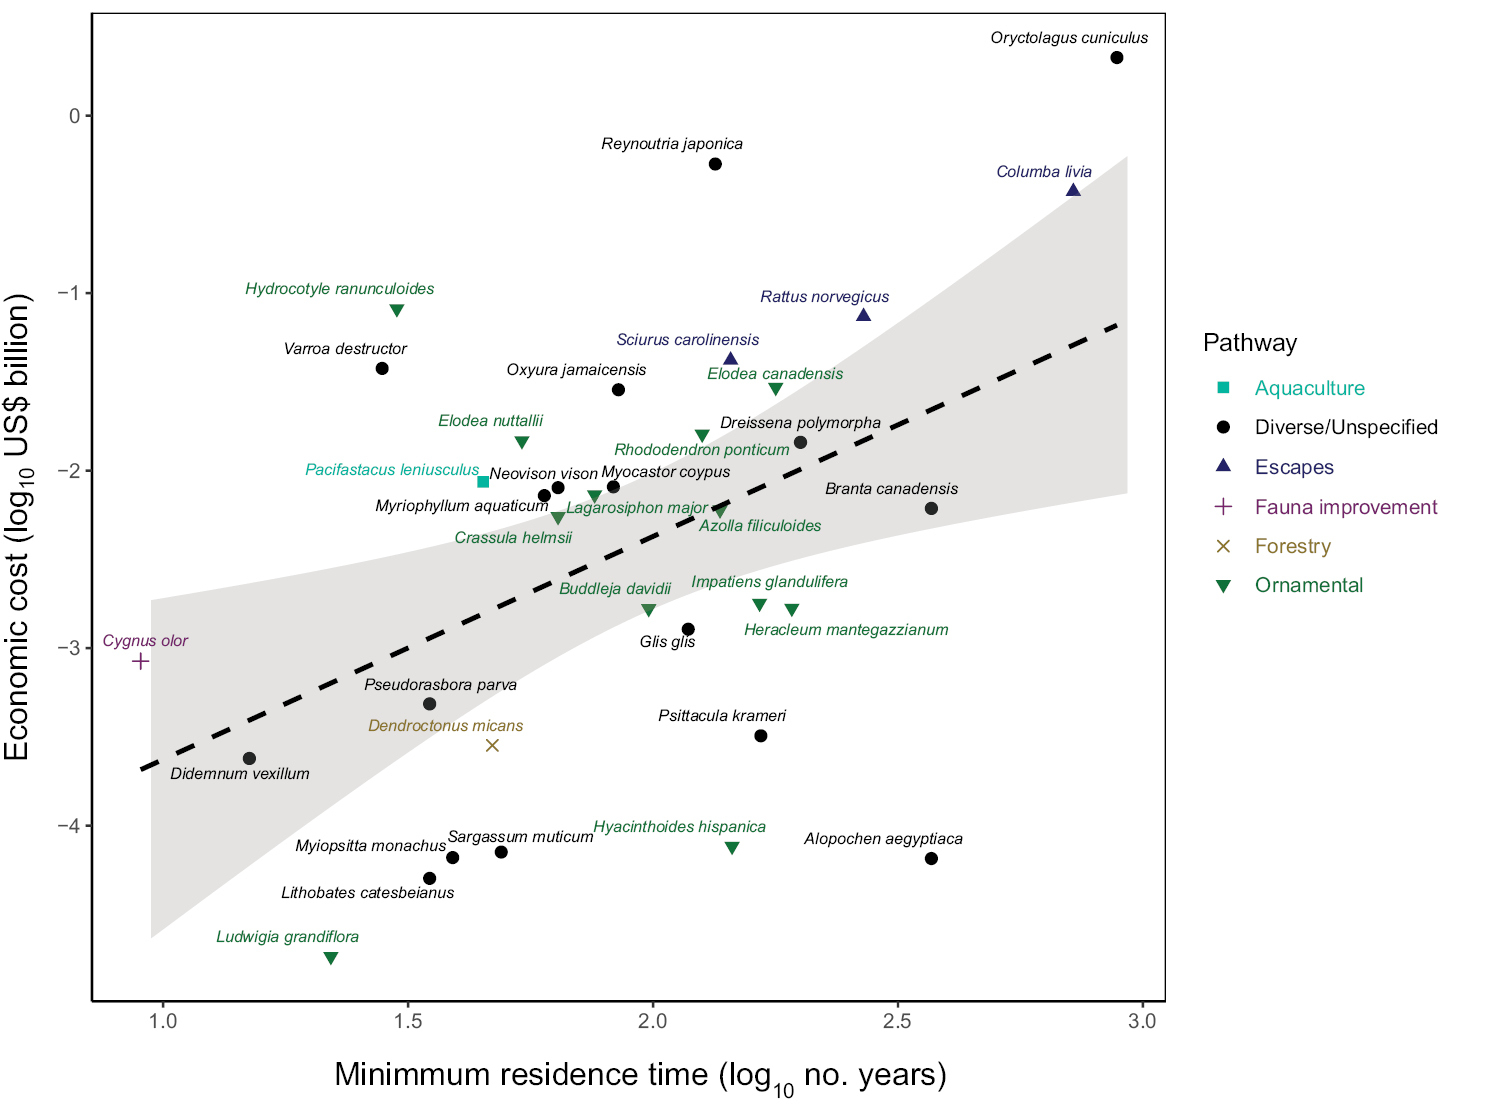
Invasion costs (US$ billions) as a function of number of years since introduction for UK invasive species. Note that both the x- and y-axes are on a log10 scale. The dashed line represents a linear regression model fit and the shaded area the 95% confidence interval. Pathways of introduction per species are indicated by different fill shapes and colours. |