|
||
|
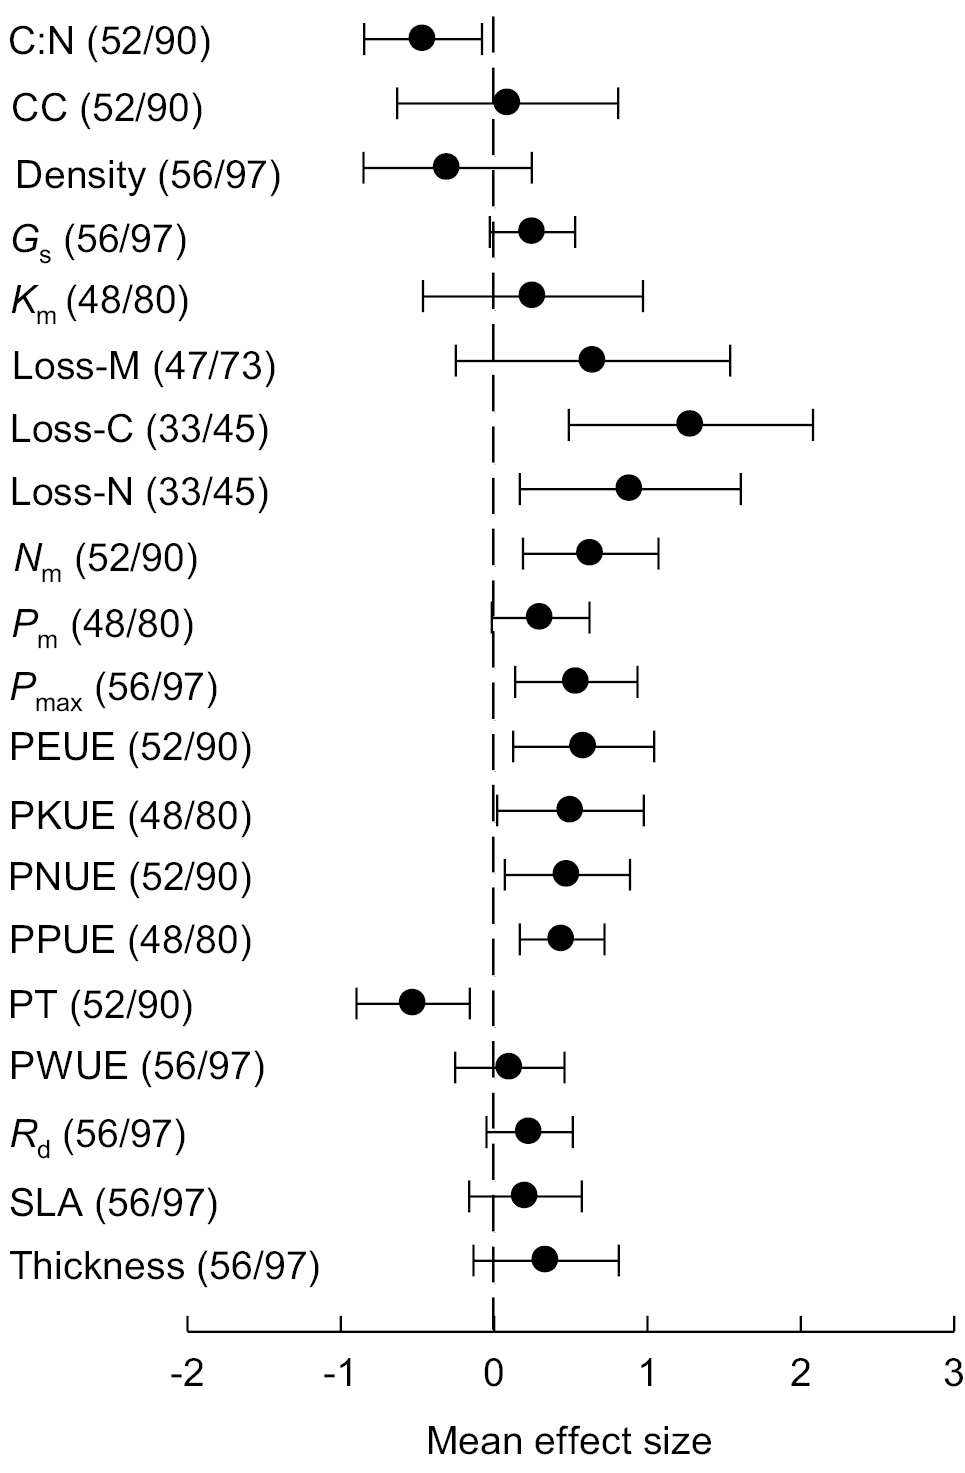
Phylogenetically informed mean effect sizes (Hedges’d) and their 95% confidence intervals showing the overall differences in 20 leaf functional traits between the invasive and native species. The figures between brackets on the left indicate the number of the invasive species included and the number of species pairs compared, respectively. C:N, leaf-carbon-to-nitrogen ratio; CC, leaf-construction costs (g glucose g-1); Density, leaf tissue density (g cm-3); Gs, mass-based leaf stomatal conductance (mmol g-1 s-1); Km, leaf-potassium concentration (mg g-1); Loss-M, leaf-mass-loss rate (%); Loss-C, leaf-carbon-loss rate (%); Loss-N, leaf-nitrogen-loss rate (%); Nm, leaf-nitrogen concentration (mg g-1); Pm, leaf-phosphorus concentration (mg g-1); Pmax, mass-based leaf light saturated photosynthetic rate (μmol g-1 s-1); PEUE, leaf photosynthetic energy-use efficiency (μmol g-1 s-1); PKUE, photosynthetic potassium-use efficiency (μmol g-1 s-1); PNUE, photosynthetic nitrogen-use efficiency (μmol g-1 s-1); PPUE, photosynthetic phosphorus-use efficiency (μmol g-1 s-1); PT, leaf-payback time (d); PWUE, photosynthetic water-use efficiency (μmol mol-1); Rd, mass-based leaf dark respiration rate (μmol g-1 s-1); SLA, specific leaf area (cm2 mg-1); Thickness, leaf thickness (mm). |