|
||
|
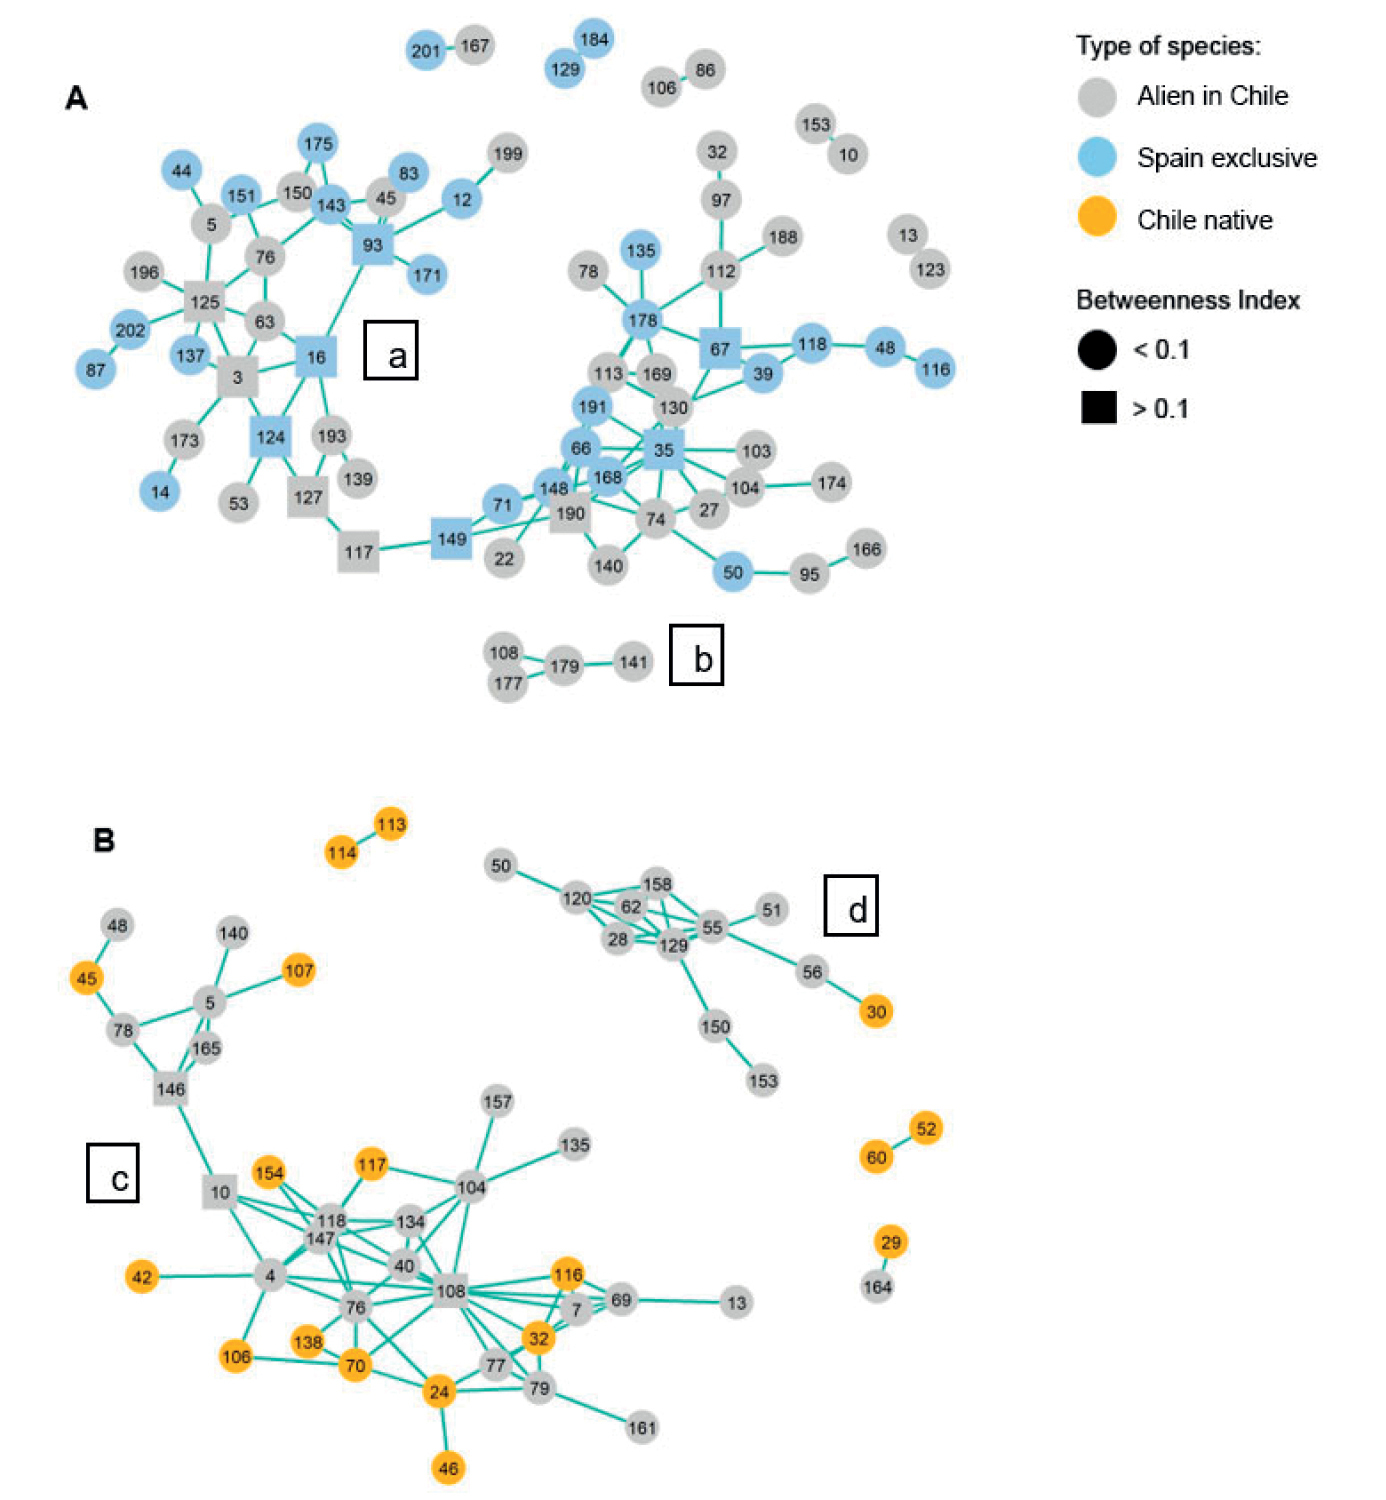
Visualisation of the co-occurrence network for both ranges. Green lines connect pairs of species that have a positive association. The numbers are the species ID and each of the three species types have a separate enumeration for each country (see Suppl. material 1: Table S1). To improve visualisation, only species involved in non-random positive associations are represented. A Positive association network of all species in the native range (Spain), where two networks have been identified, one large (a) and one small (b) . B Positive association network of all species in the invaded range (Chile), where two networks have been identified, one large (c) and one medium (d) . |