|
||
|
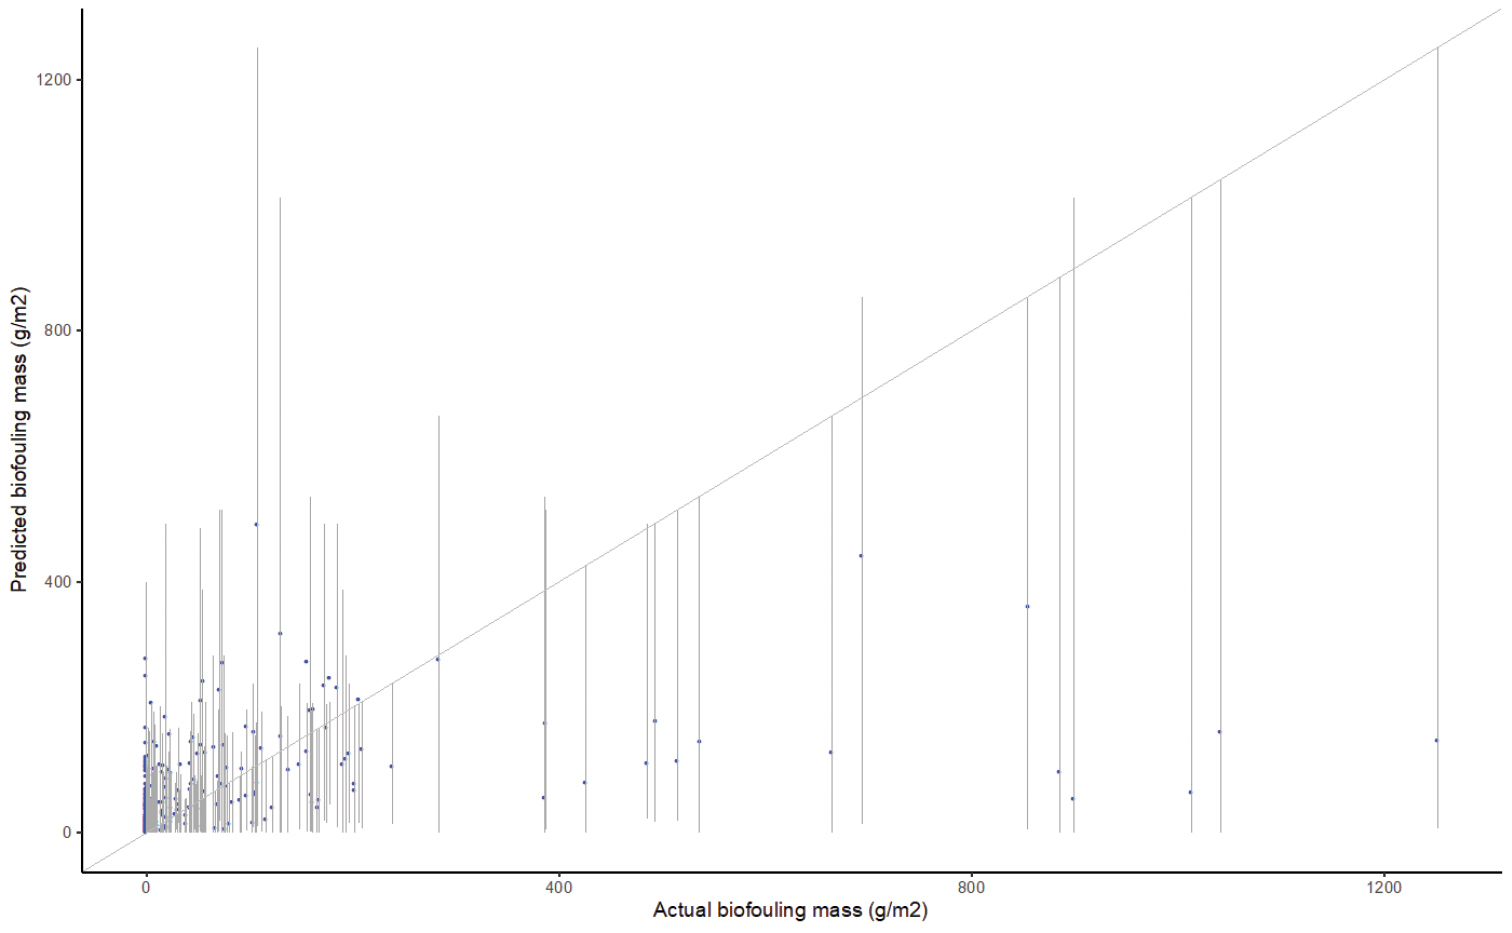
The variation of the actual biofouling mass (g/m2) versus the predicted biofouling mass (g/m2). The vertical grey lines represent the 10% and 90% quantiles of predicted values. The diagonal line shows the 1:1 relationship. |
|
||||||||
| Part of: Hatami R, Inglis G, Lane SE, Growcott A, Kluza D, Lubarsky C, Jones-Todd C, Seaward K, Robinson AP (2022) Modelling the likelihood of entry of marine non-indigenous species from internationally arriving vessels to maritime ports: a case study using New Zealand data. NeoBiota 72: 183-203. https://doi.org/10.3897/neobiota.72.77266 |