|
||
|
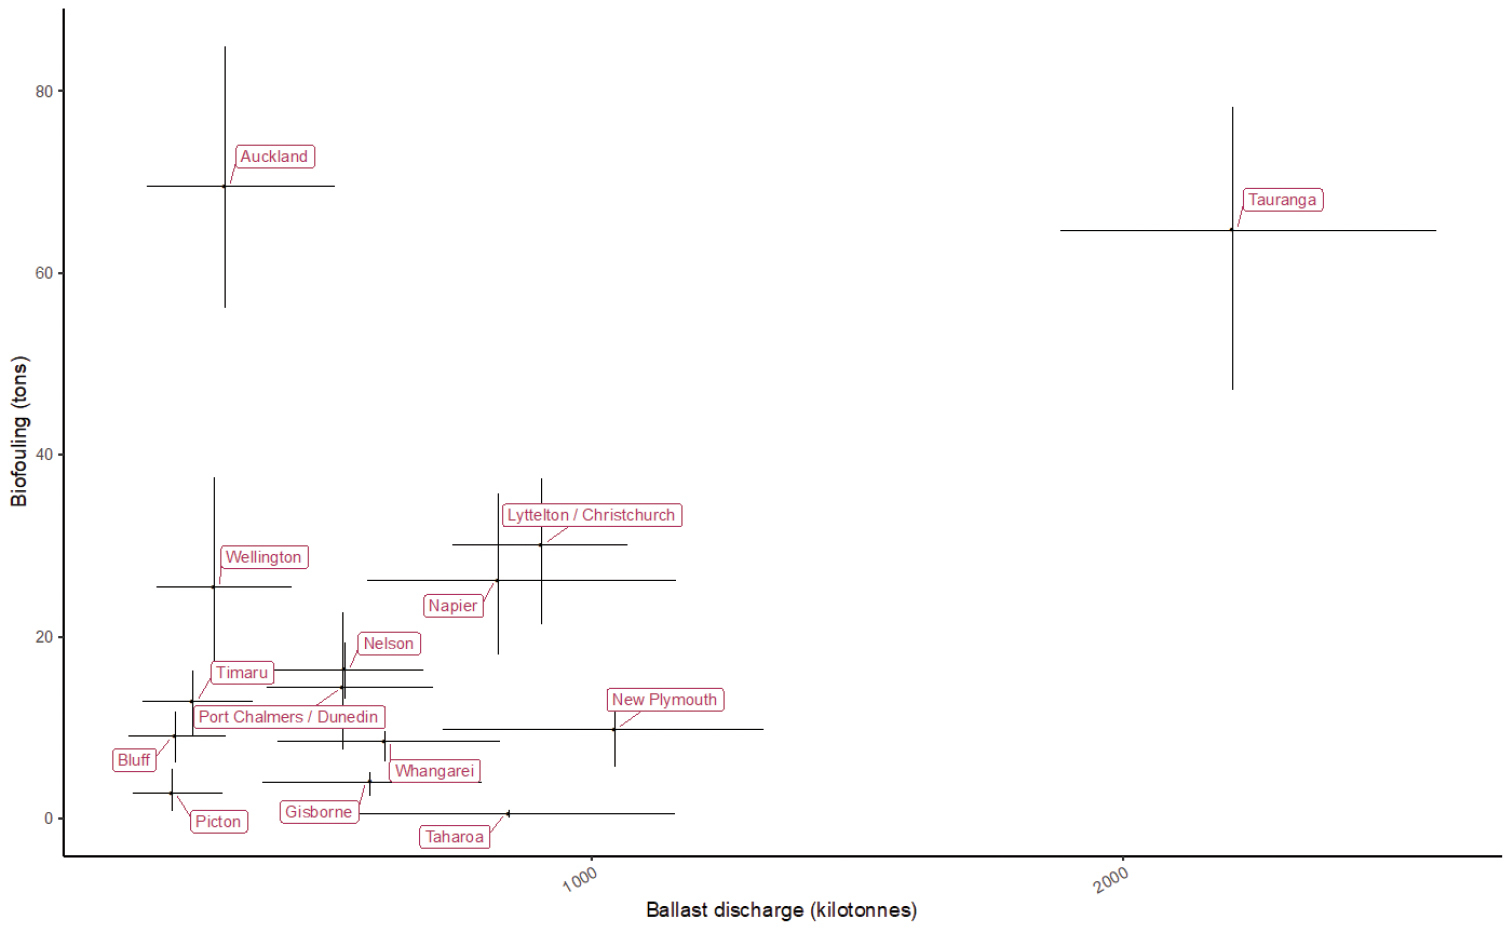
Predicted vessel ballast water discharge (kilotonnes) vs biofouling exposure (tonnes) per port. The figure displays the mean and 10% and 90% quantiles of the bootstrap distribution for ballast water and from the prediction distribution for biofouling. The values are the average of ballast water and biofouling mass over years 2015 – 2017. |