|
||
|
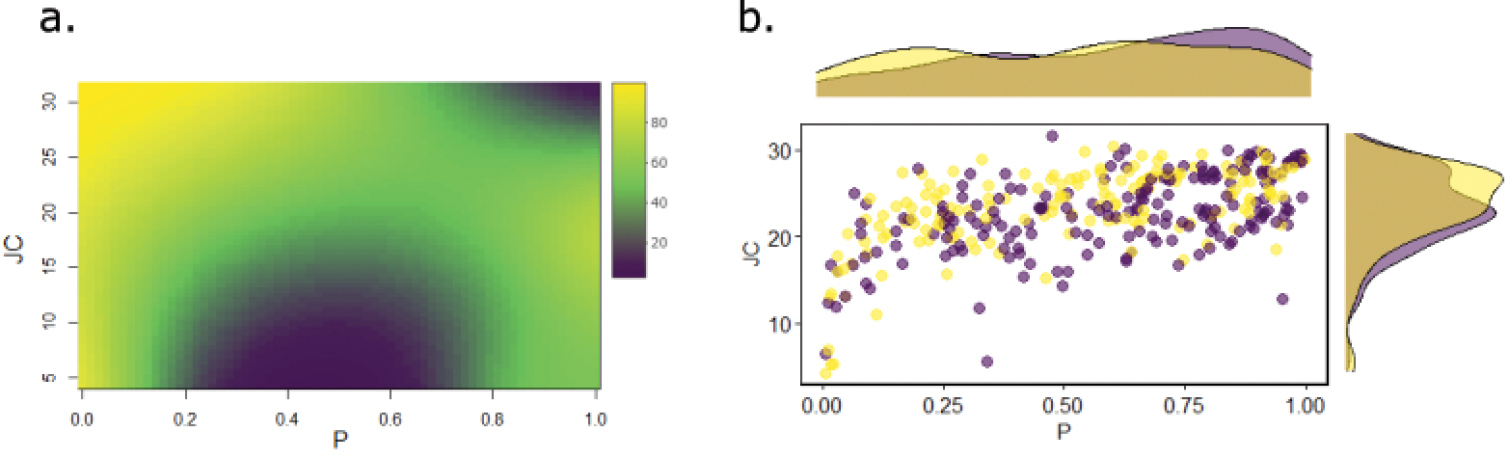
a The overall relation between the probability of occurrence of S. inaequidens and the spatial configuration of marram grass. The colours indicate the probability of occurrence as %. b Density distribution plots of the observed cover (P) and spatial autocorrelation (JC) of marram grass within a 5 m radius of the central marram grass tussock. This plot only contains the data of the transects where S. inaequidens was found. Colours indicate whether S. inaequidens was present (yellow) or absent (purple). |