|
||
|
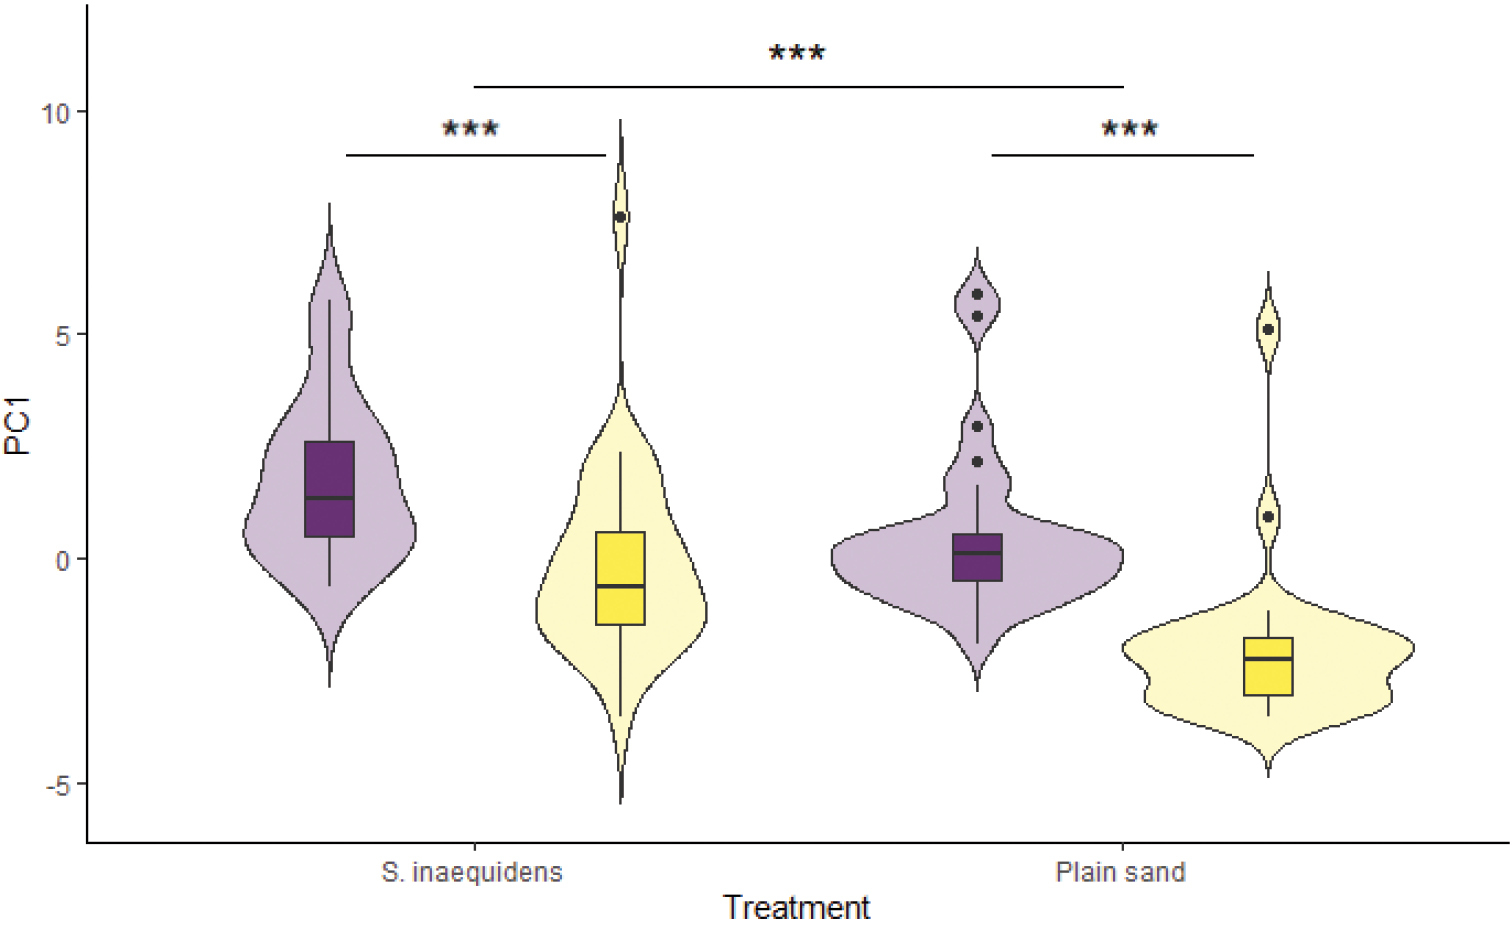
Box- and violin plots represent distribution of PC1 values for marram grass growth. Horizontal lines above the boxplots indicate comparisons between treatments, *** indicate significant difference of p < 0.001. Colours indicate whether biota were present (yellow) or absent (purple). Number of samples per treatment is 29, except for sterilized sand from unvegetated locations, where it is 30. |