|
||
|
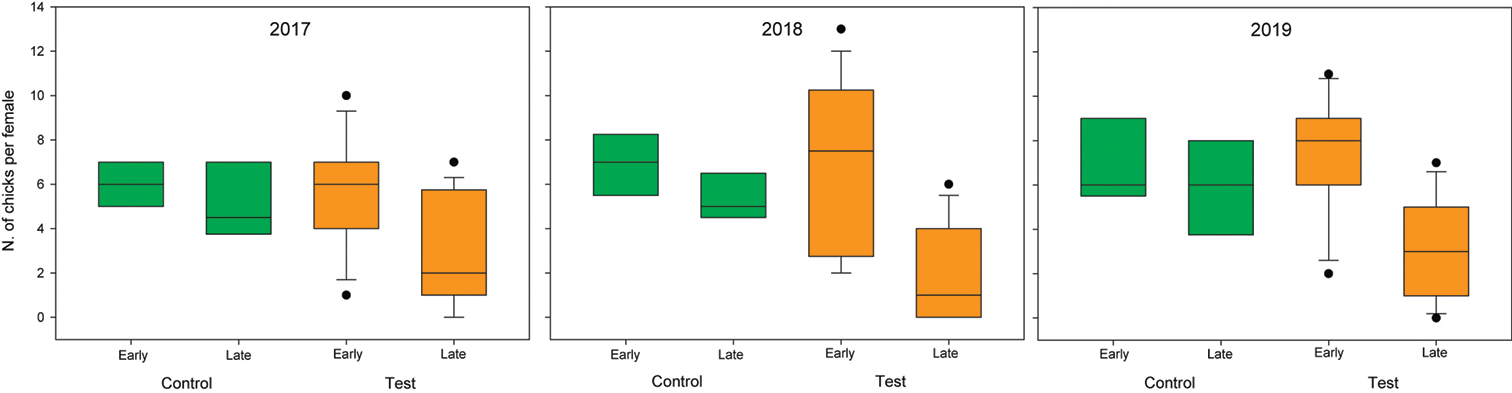
Mallard chicks per pair in the control (green) and test (orange) areas, as detected in early (mid-April/mid-May) and late (June) stages of the chicks growing period. In boxplots, black horizontal lines represent medians, boxes represent the first and third quartile, whiskers represent minimum and maximum values and dots represent extreme values. |