|
||
|
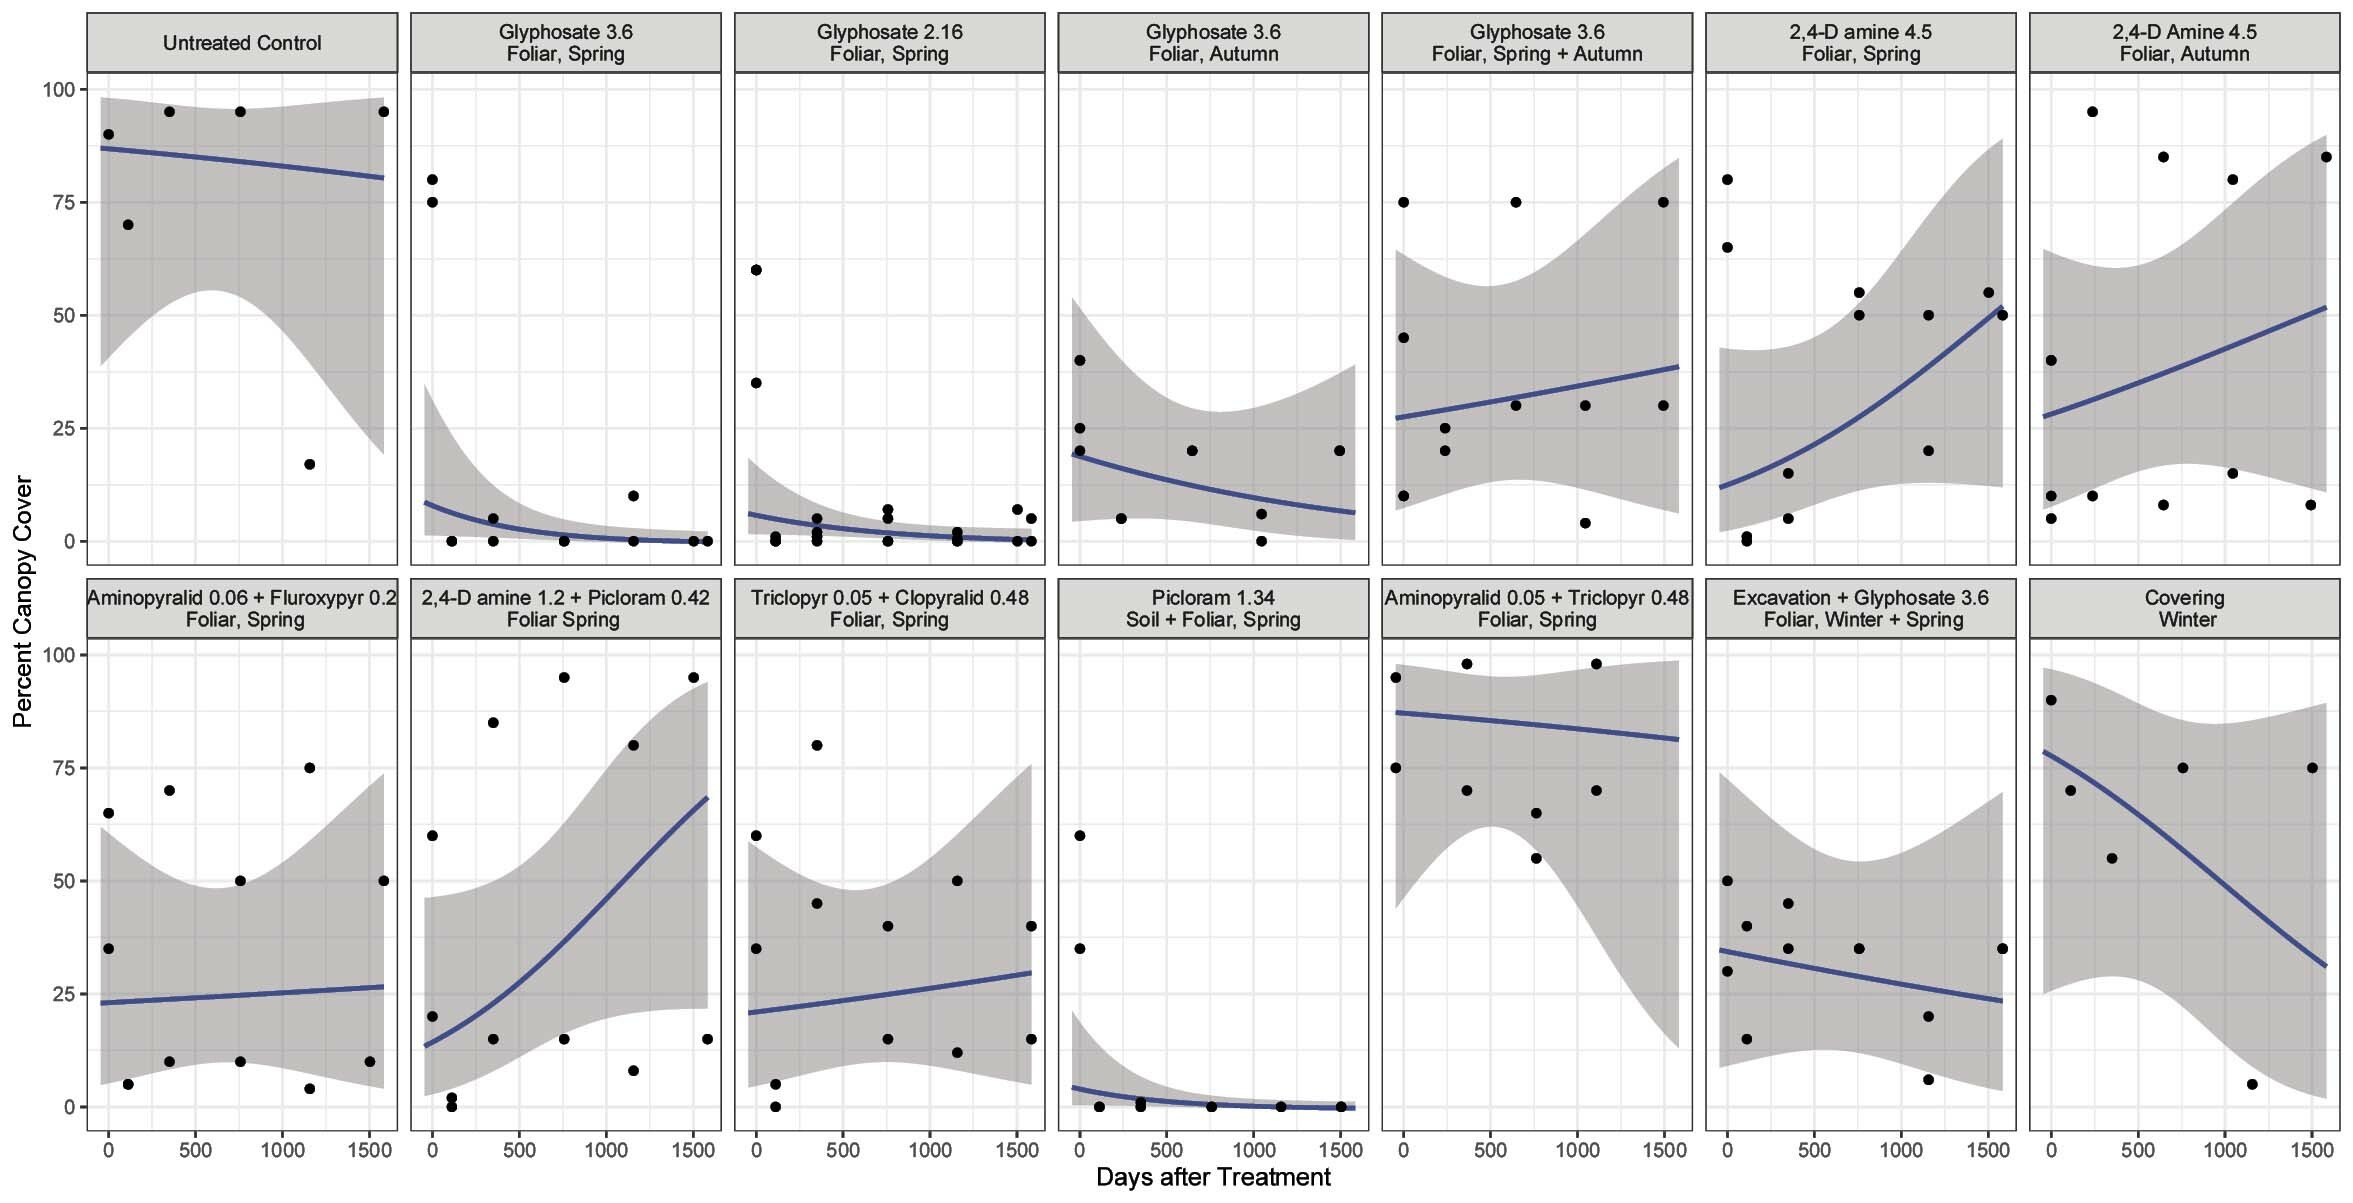
Efficacy of different P. pyrenaicus control methods over time, including one untreated control group. Active ingredients, application rates, method and timing are given above each plot. Solid lines and shaded areas (95% CIs) are back-transformed from leaf canopy cover data that was logit transformed (+0.5% in all cases) before fitting a linear model with Days After Treatment and Treatment Group as (interacting) predictor variables (F27,134 = 5.5, p < 0.001, R2 = 0.53). |