|
||
|
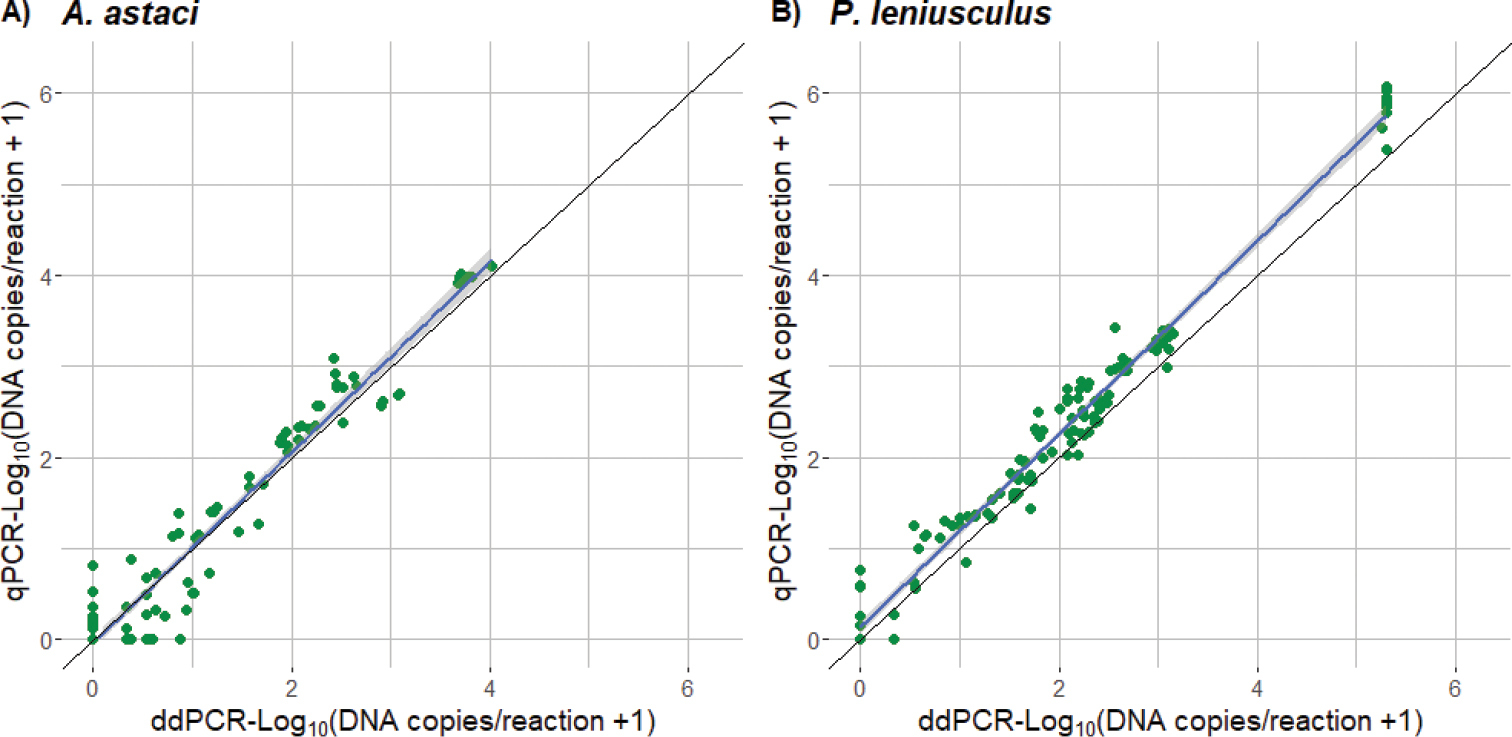
Scatterplot of the estimated DNA copies per reaction of both qPCR and ddPCR analysis for A. astaci (A) and P. leniusculus (B) from the mesocosm trial. A significant positive correlation between the methods was observed. A) A. astaci: Pearson’s r = 0.98, p < 2.2×10⁻⁶. B) P. leniusculus: Pearsons’s r = 0.99, p < 2.2×10⁻¹⁶. Black line represents 1:1 correspondence between ddPCR and qPCR. |