|
||
|
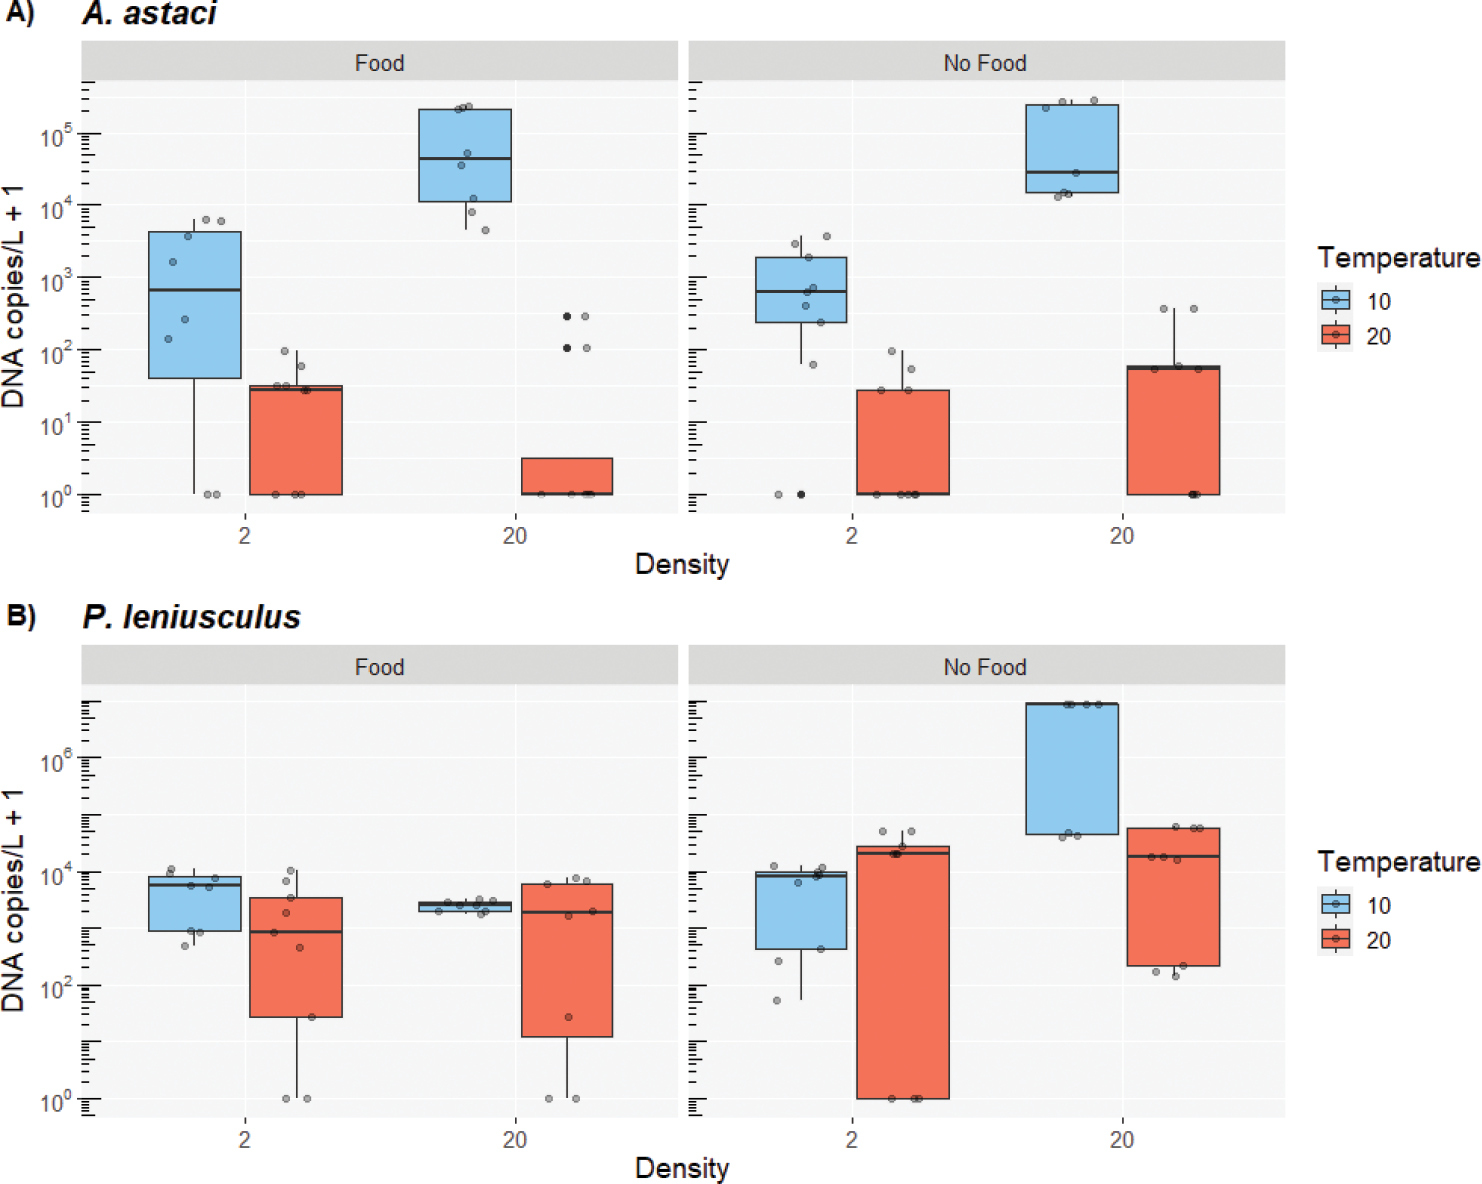
Boxplot of detectable eDNA copies per litre for A. astaci (A) and P. leniusculus (B), as detected by ddPCR. For temperature, the blue box indicates the interquartile range at 10 °C, while the red box indicates the interquartile range at 20 °C. Density is indicated by 2 (crayfish per tank) and 20 (crayfish per tank) and the median is represented by the thick black horizontal bar within the boxes. A for A. astaci, the median copy number/l was generally very low at 20 °C, while high median copy numbers/l were observed at 10 °C and high crayfish density. Food had no apparent effect B for P. leniusculus, the highest median eDNA copy number/l was observed at high crayfish density at 10 °C, with no food. The median copy number/l was generally substantially lower at 20 °C and, in particular, in the tanks where crayfish were fed. Food had a negative effect on eDNA copy numbers both at 10 °C and 20 °C. |