|
||
|
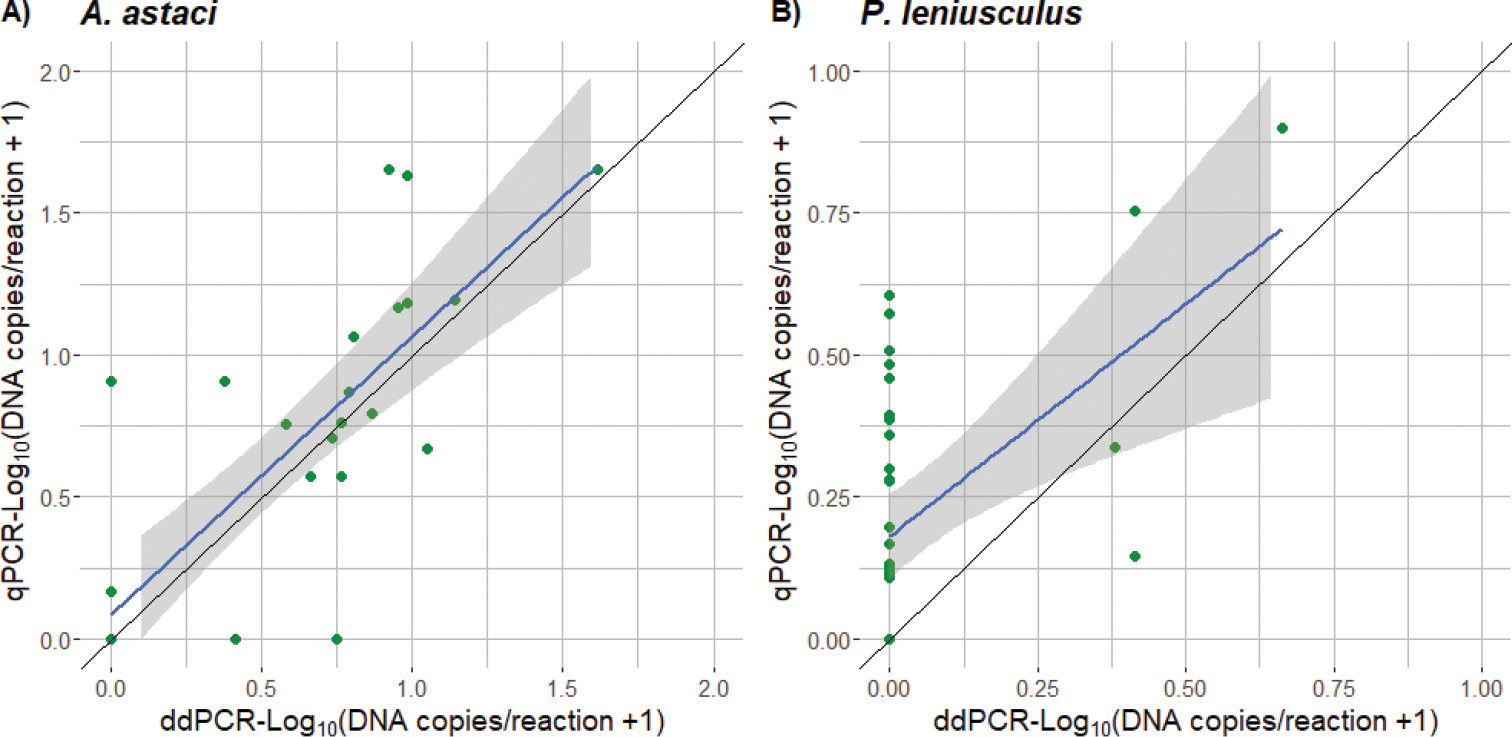
Scatterplot of the estimated DNA copies per reaction of both qPCR and ddPCR analysis for A. astaci (A) and P. leniusculus (B) from Lake Øymarksjøen. A for A. astaci, the correlation between qPCR and ddPCR results is relatively good (Pearson’s r = 0.81, p = 2.4×10⁻¹⁰) B for P. leniusculus, the correlation between qPCR and ddPCR results is poor (Pearson’s r = 0.53, p = 0.0011). Black line represents 1:1 correspondence between ddPCR and qPCR. |