|
||
|
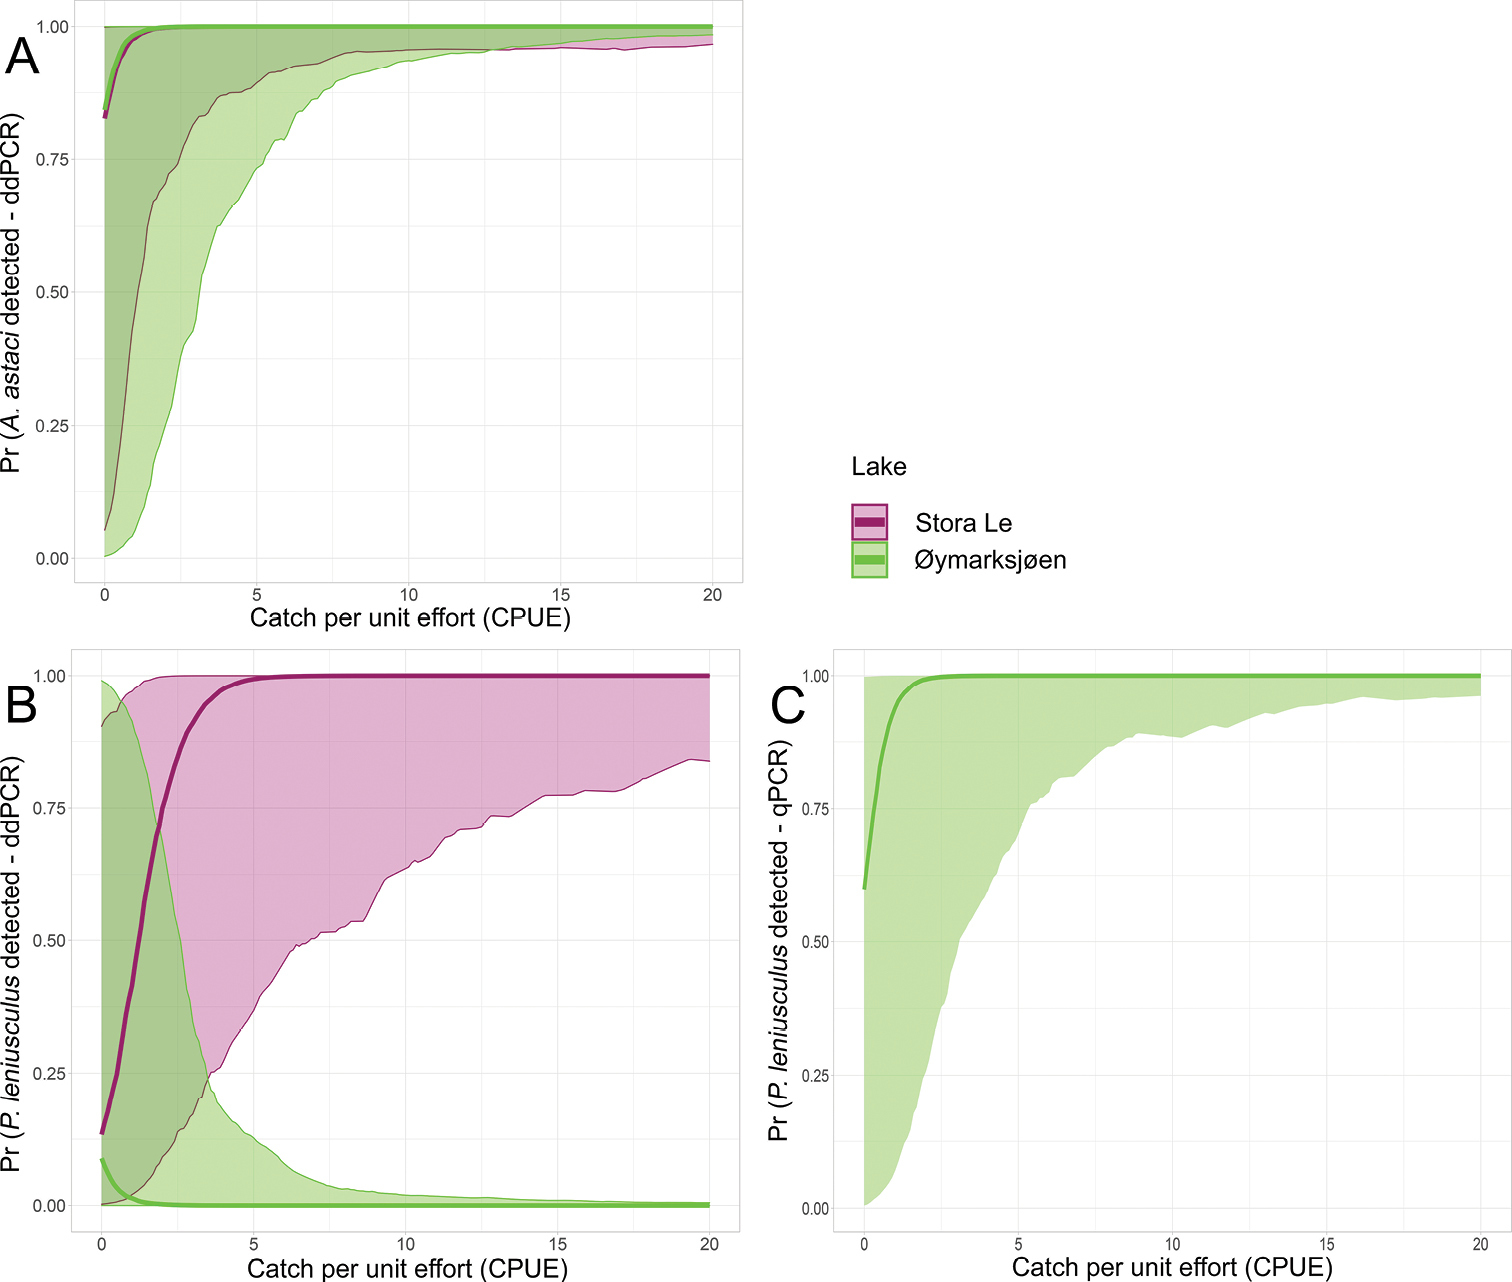
Modelling of probability of detection for A. astaci (A) and P. leniusculus (B) with respect to catch per unit effort (CPUE) in lakes Øymarksjøen (green line) and Stora Le (purple line) using msocc, based on ddPCR results. The thick lines represent the median detection probability, while the thin lines represent the upper and lower quantile. The figures are based on 11000 iterations, the first 1000 as warm-up and the rest thinned by 10. Figure 7C depicts the probability of P. leniusculus detection in relation to CPUE in Lake Øymarksjøen, based on qPCR results. |