|
||
|
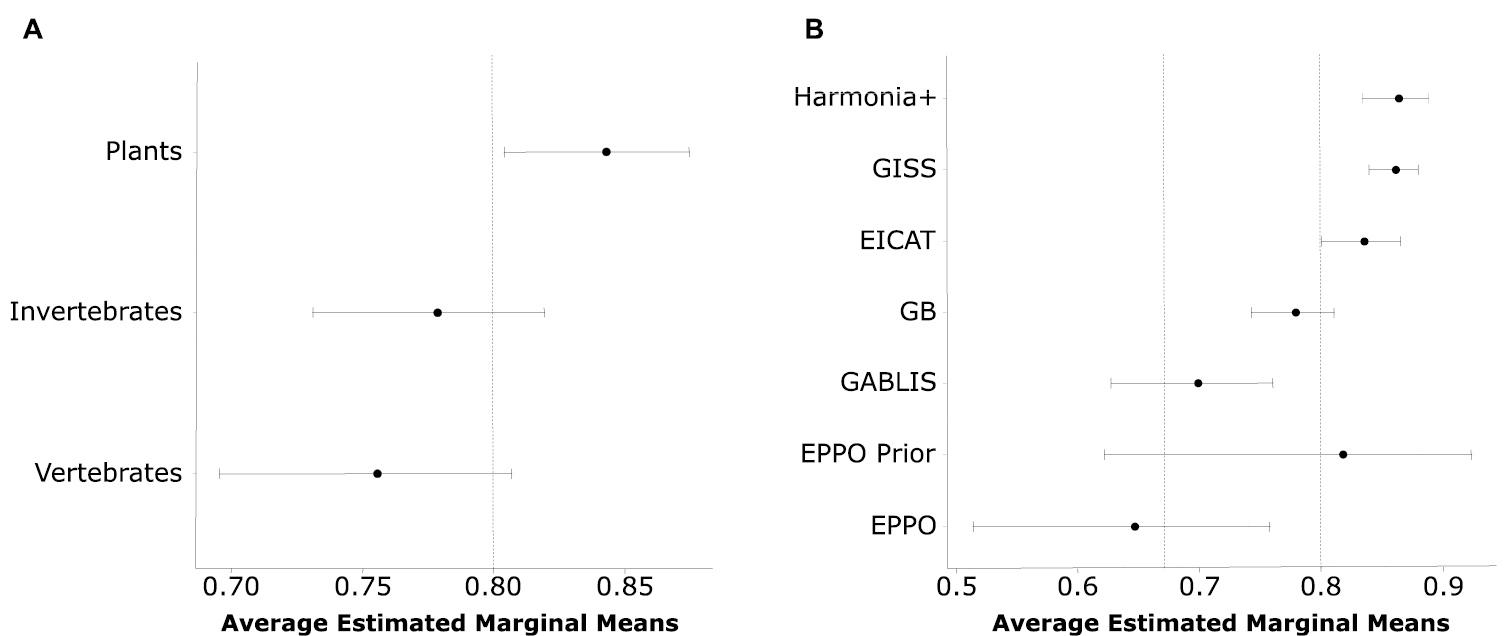
Estimated inter-rater reliability (GProt-Spp values) when scoring species belonging to different taxonomic groups (A) or using different protocols (B). Values averaged over the levels of the variable taxonomic group and protocol, A and B, respectively, included in the beta regression model (i.e. average estimated marginal means). The dot depicts the mean and the brackets the confidence level at 95%. X-axis values apply the R function emmeans with type ‘response’. The vertical dotted lines represent the thresholds used to categorise the coefficients G as low, medium and high consistent. |