|
||
|
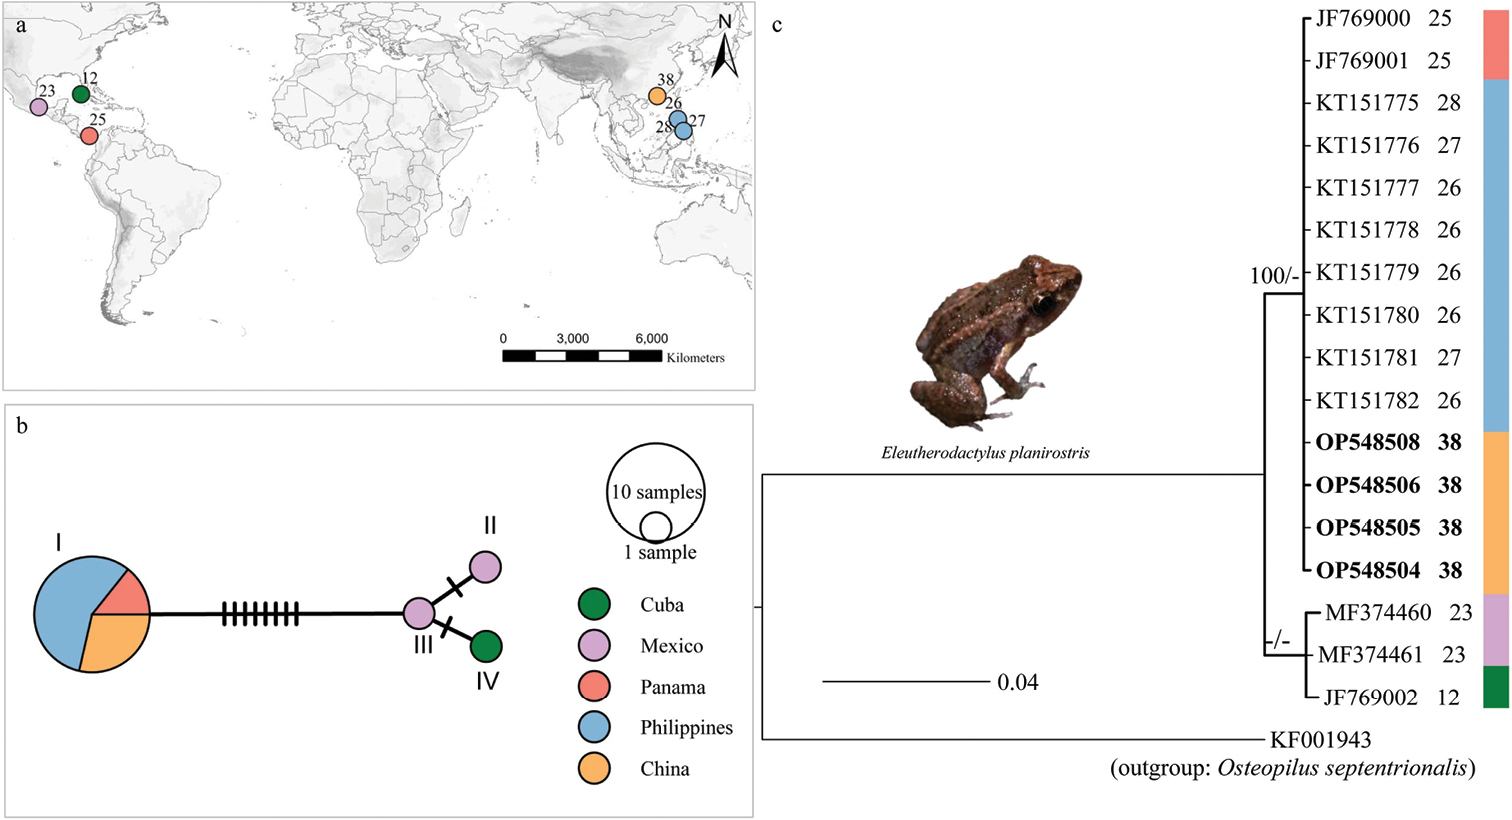
a sample distribution and results for the mitochondrial COI sequences; each number represents a different sequence location b relationship among the network of haplotypes of the greenhouse frog (Eleutherodactylus planirostris). The size of the circles is proportional to haplotype frequency. Each color represents a locality/country c bayesian/maximum likelihood phylogenetic tree of the greenhouse frog inferred from a fragment of the COI gene. “-” denotes low support by Bayesian posterior probabilities (BPP < 95%) and bootstrap support (BS < 70%). Colors indicate mitochondrial lineages, and each color represents a different country: Cuba (dark green), Mexico (purple), Panama (red), the Philippines (blue), and China (orange). E. planirostris image: from http://www.amphibiachina.org/. |