|
||
|
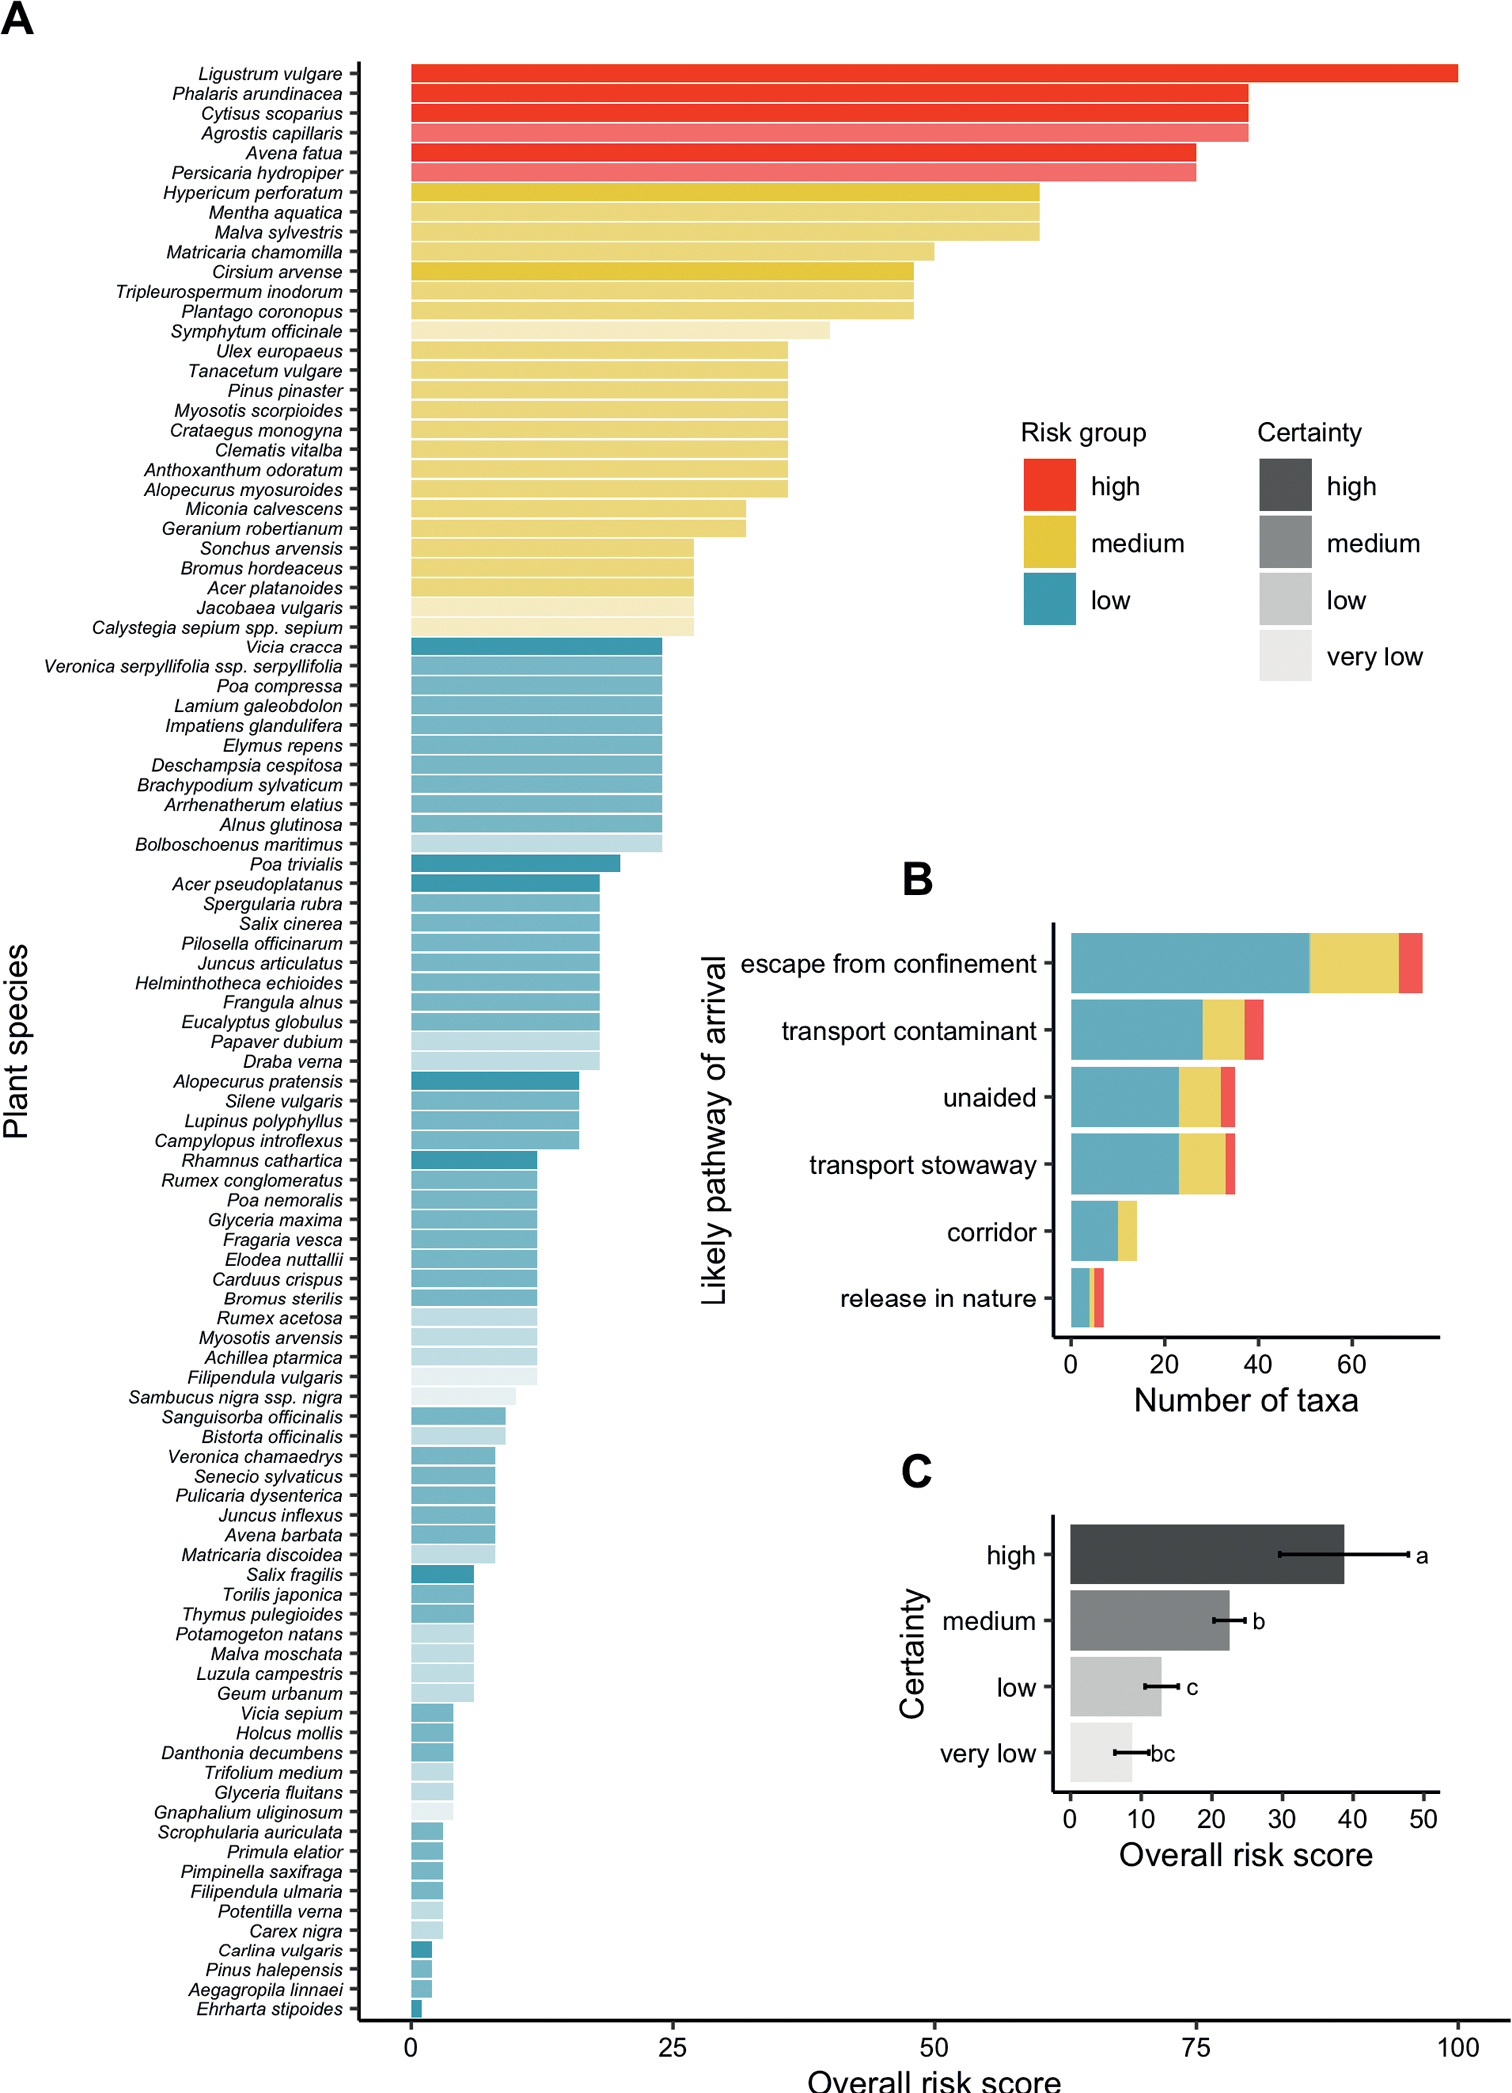
Overall likelihood scores from the horizon scan of potential invasive plant threats to Florida A the overall risk scores for 99 taxa, divided into groups of high risk (score ≥ 64), medium risk (27 ≤ score < 64), and low risk (score < 27) and shaded by overall certainty rating B the number of taxa associated with each of the pathways of arrival. Multiple pathways could be assigned to a single taxon. C the relationship between certainty and the overall risk score, averaged across all taxa. Letters above bars indicate significant differences in overall risk score among certainty ratings with P < 0.05. |