|
||
|
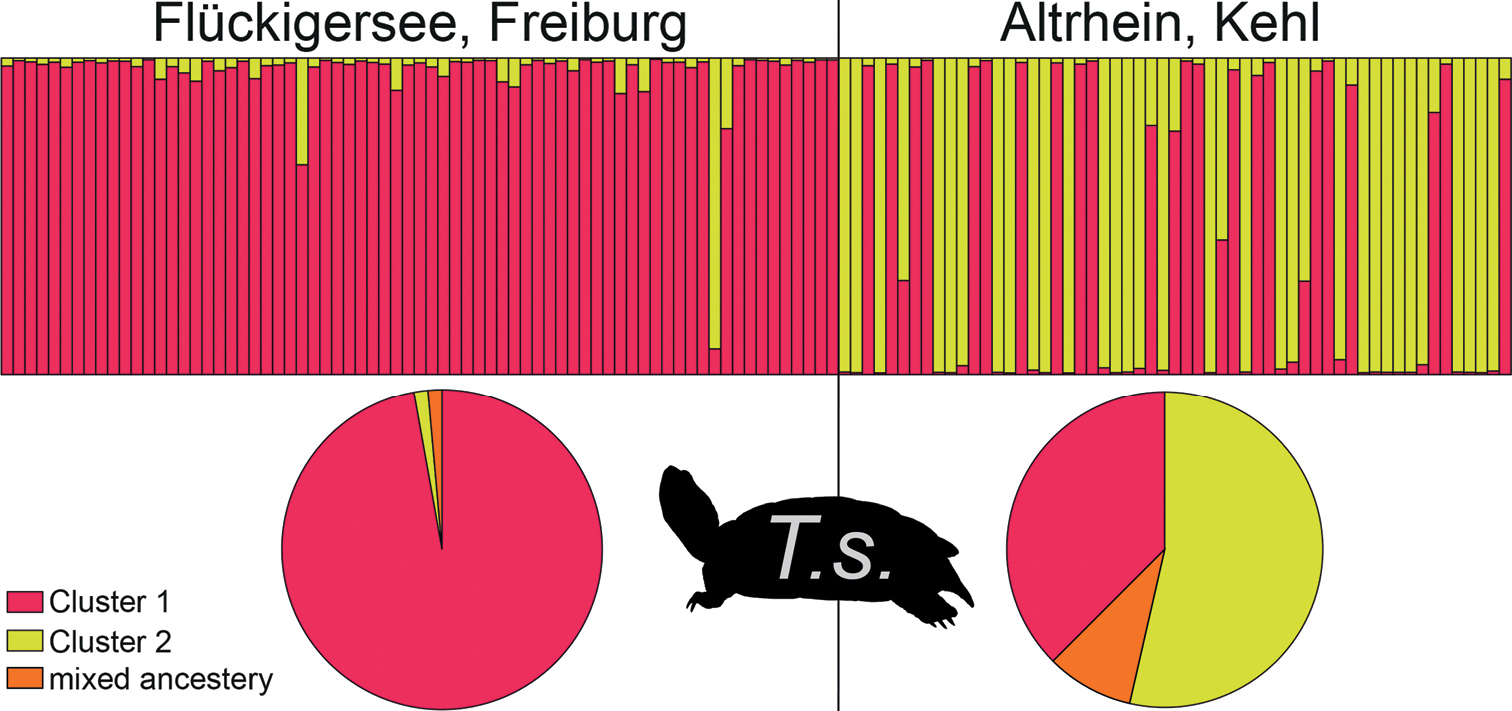
Population structuring in Trachemys scripta (T. s.) for K = 2 from the STRUCTURE run with the highest probability value. Revealed cluster (red, yellow) are presented in distinct colours. Each vertical bar represents one individual and its calculated proportion of cluster membership. Colours of pie charts correspond to STRUCTURE clusters; orange slices represent chelonians with mixed ancestry (percentages). |