|
||
|
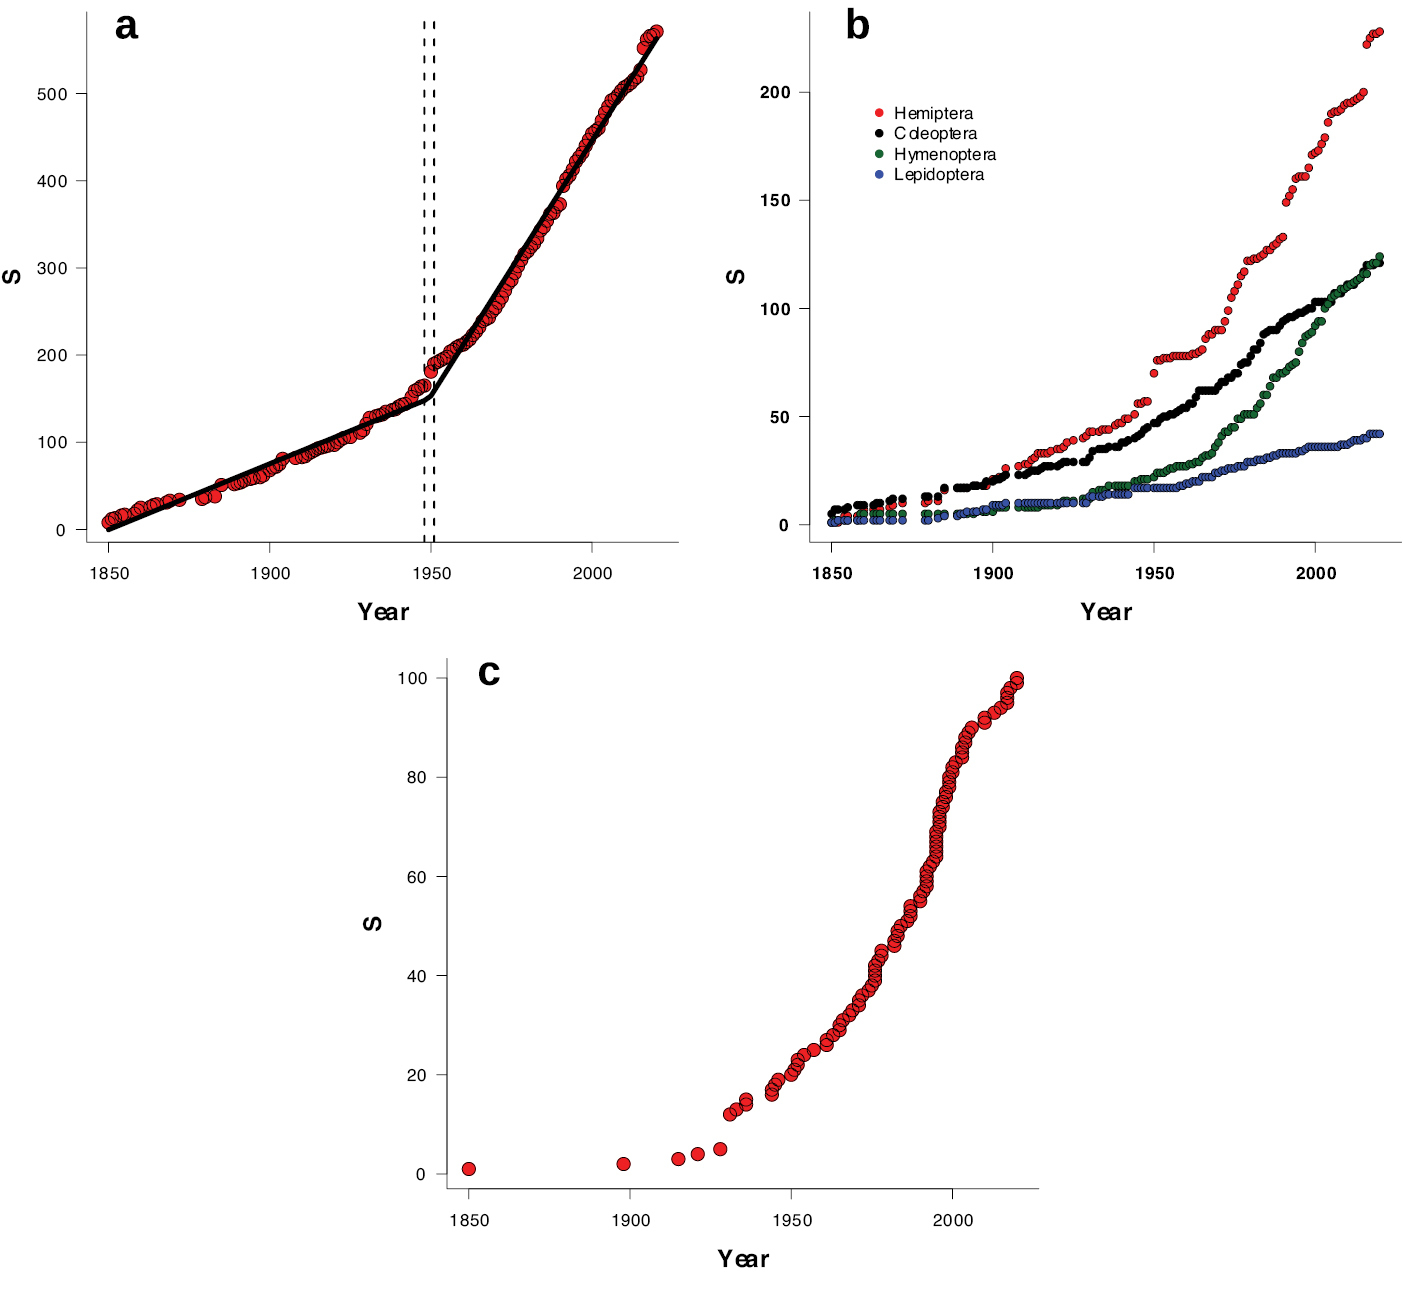
Temporal trend of the accumulated number of non-native species in Chile (S) a total number of species. Points correspond to observed data, the black line corresponds to the fit of the regression model and the dashed lines indicate the 95% confidence interval for the break-point in the segmented regression b number of species of the most abundant orders c number of species identified as biological control agents. |