|
||
|
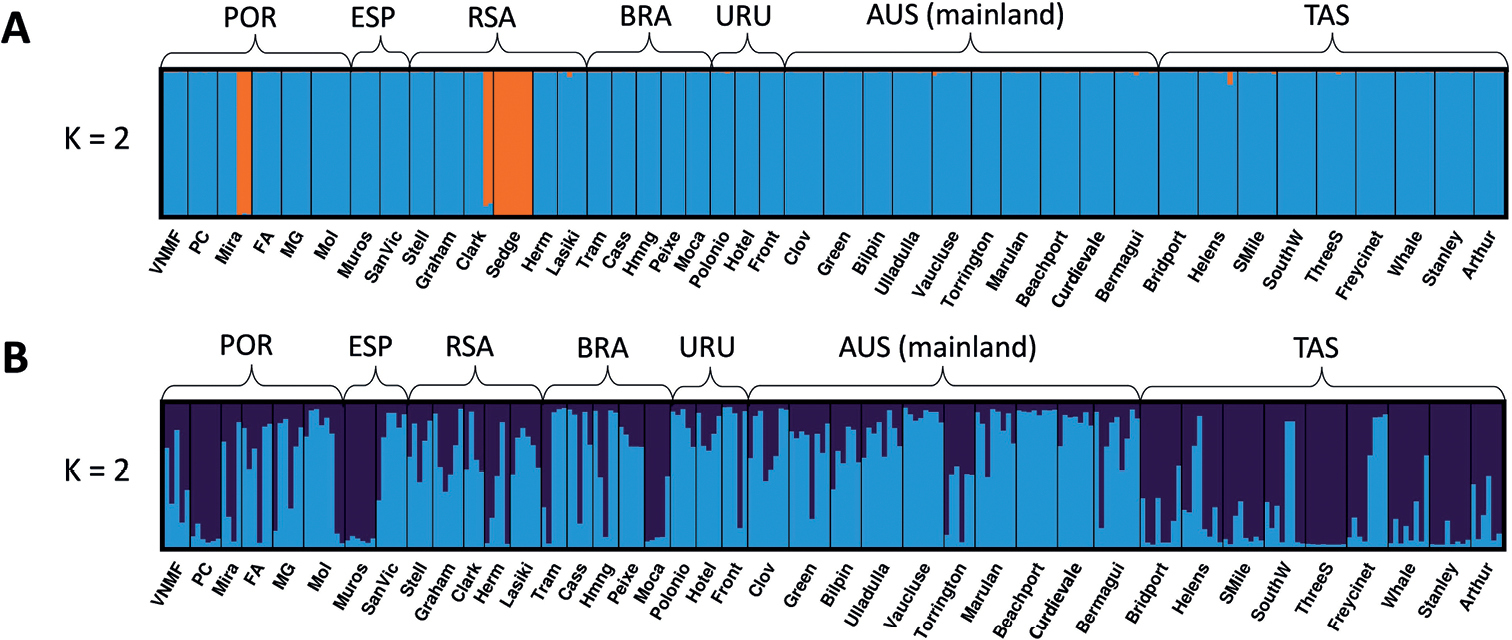
STRUCTURE bar plots (K = 2) in the invasive and native ranges of Acacia longifolia A bar plot for the complete dataset B bar plot for the hierarchical analysis of the blue cluster in A. Population names underneath the plots correspond to the codes provided in Table 1. |