|
||
|
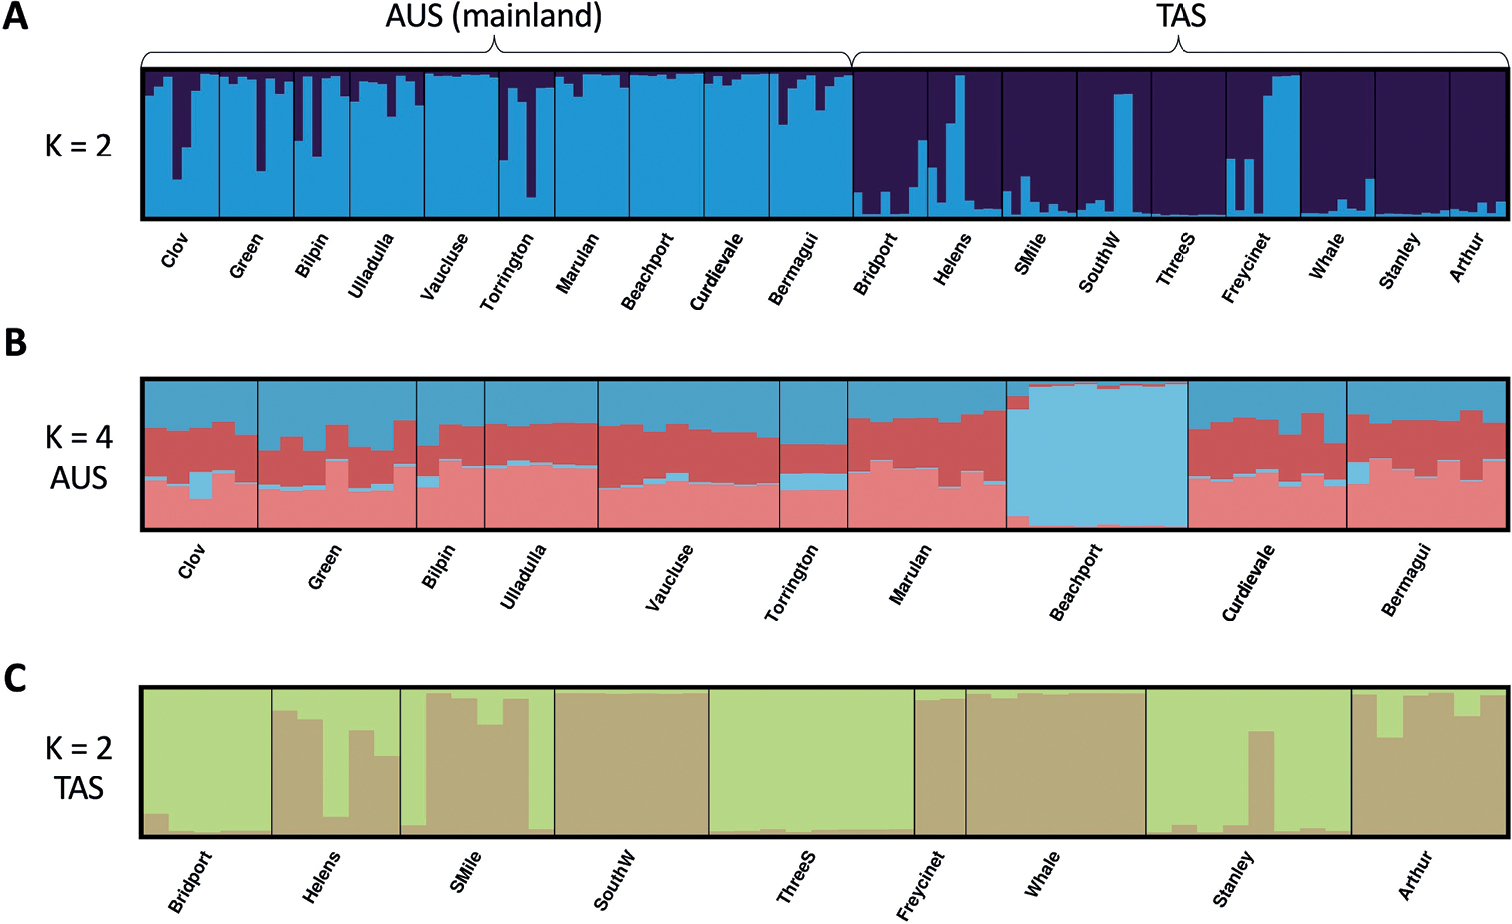
STRUCTURE bar plots for the identified optimum number of clusters in Acacia longifolia’s native range A bar plot for the overall native range (K = 2) B bar plot for the mainland Australia cluster (K = 4) C bar plot for the Tasmania cluster (K = 2). Population names underneath the plots correspond to the codes provided in Table 1. |