|
||
|
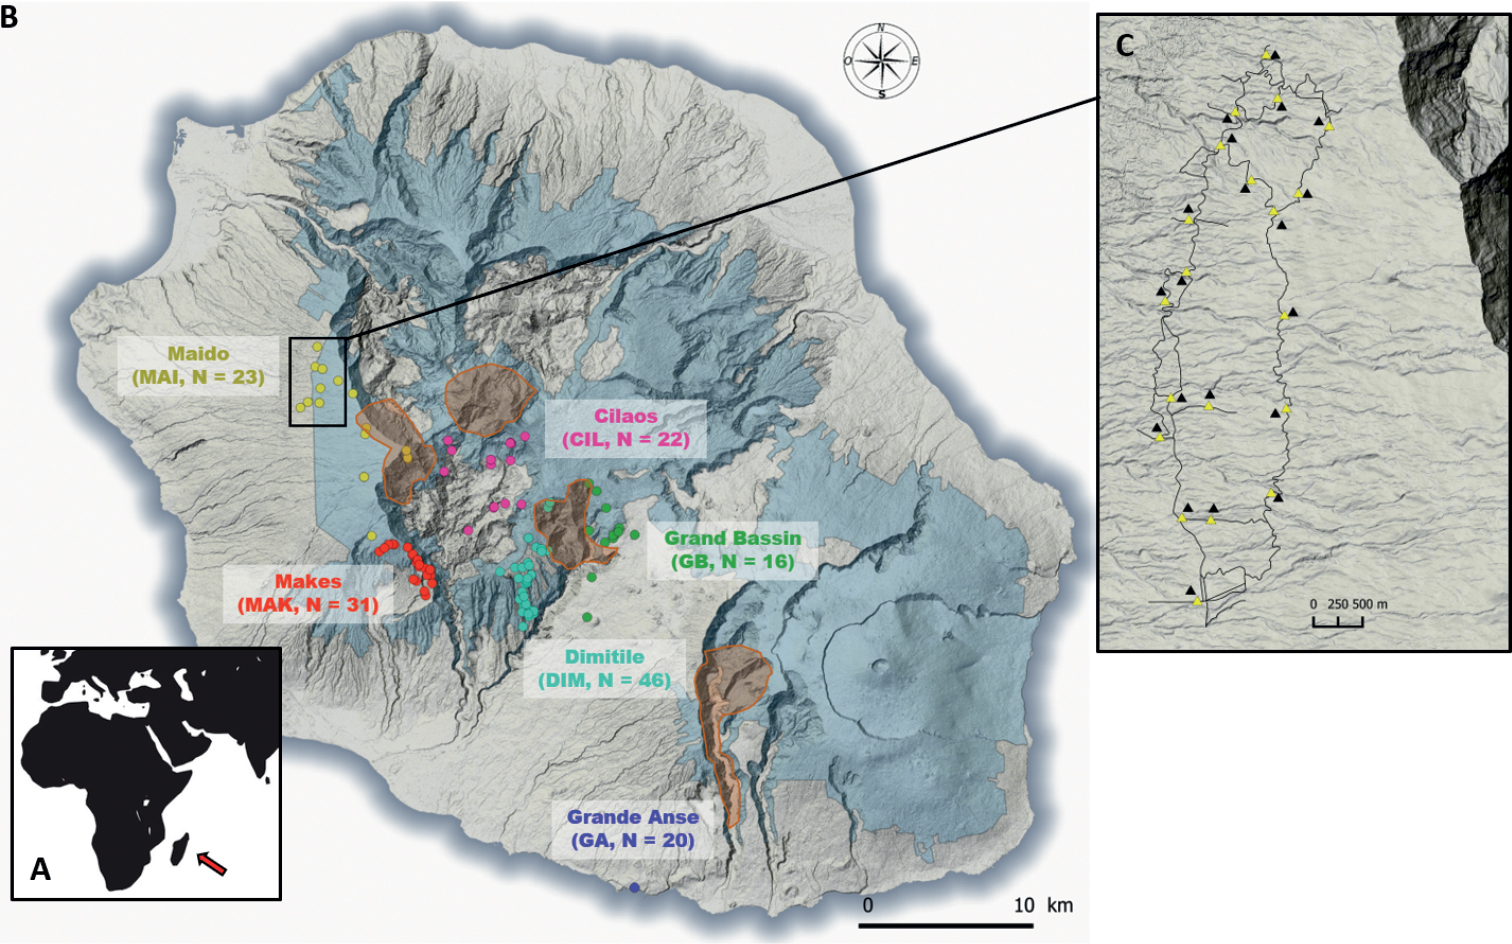
Maps illustrating A the locality of Réunion Island B genetic sampling sites, in 2015–2016 and C camera trapping sites in 2016. Each colour of dots corresponds to a different geographical area. Area codes and sample sizes are indicated in parentheses. The grey area corresponds to the National Park and the orange areas correspond to the presence of Barau’s and Mascarene Petrels. Triangles correspond to the localities of camera traps on trails (yellow triangles) and under vegetation cover (black triangles). The black lines show the trails. |