|
||
|
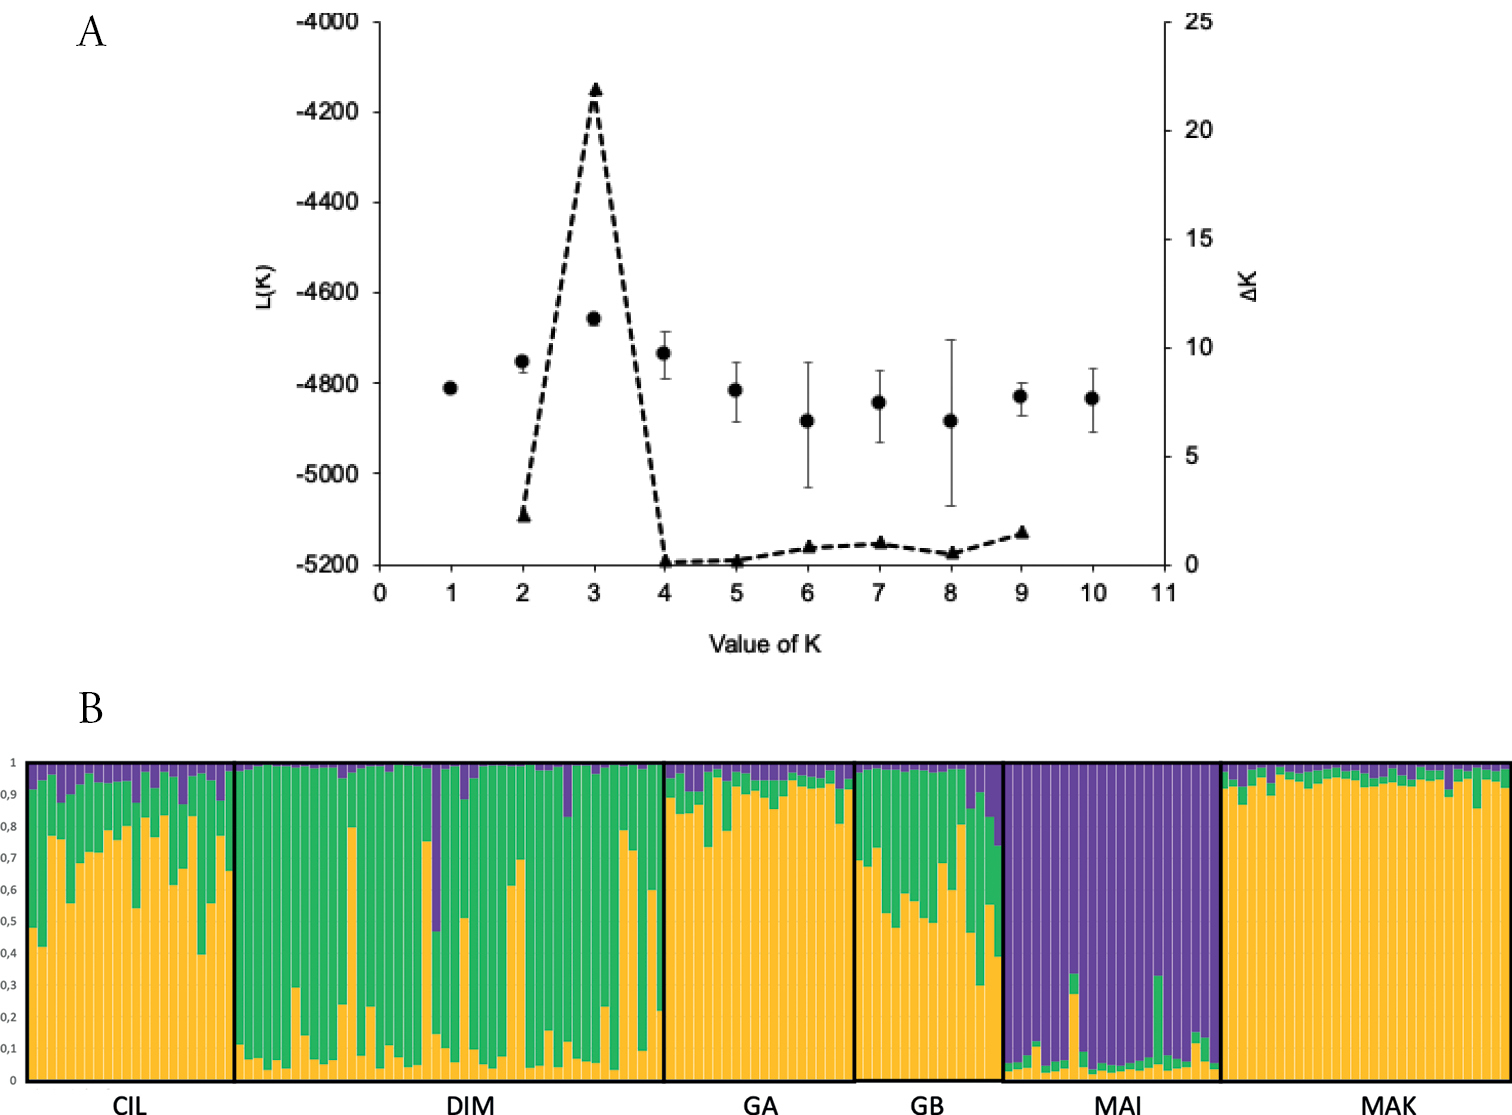
Cluster analysis of 158 feral cats from six geographical areas, on Réunion Island, 2015–2016 A detection of the number of genetic clusters K using the log-likelihood mean values L(K) (black circles; ± standard deviation) and ΔK statistic (black triangles; Evanno et al. 2005) as derived from STRUCTURE with K ranging from 1 to 10 with each value obtained by averaging the posterior probabilities over 10 independent runs B proportional membership probability to a given genetic cluster. Colours correspond to genetic clusters. Area codes are detailed in Fig. 1. |